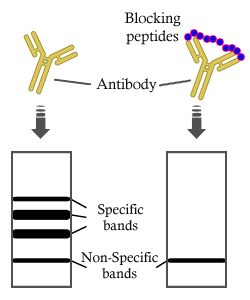
Product: NFAT1 Antibody
Catalog: DF7189
Description: Rabbit polyclonal antibody to NFAT1
Application: WB
Reactivity: Human, Mouse, Rat
Prediction: Pig, Bovine, Horse, Rabbit, Dog, Chicken, Xenopus
Mol.Wt.: 100-150kD; 100kD(Calculated).
Uniprot: Q13469
RRID: AB_2839141

View similar products>>

   Size Price Inventory
 100ul $280 In stock
 200ul $350 In stock

Lead Time: Same day delivery

For pricing and ordering contact:
Local distributors

Product Info

Source:
Rabbit
Application:
WB 1:500-1:1000
*The optimal dilutions should be determined by the end user.
*Tips:

WB: For western blot detection of denatured protein samples. IHC: For immunohistochemical detection of paraffin sections (IHC-p) or frozen sections (IHC-f) of tissue samples. IF/ICC: For immunofluorescence detection of cell samples. ELISA(peptide): For ELISA detection of antigenic peptide.

Reactivity:
Human,Mouse,Rat
Prediction:
Pig(100%), Bovine(100%), Horse(100%), Rabbit(100%), Dog(100%), Chicken(100%), Xenopus(88%)
Clonality:
Polyclonal
Specificity:
NFAT1 Antibody detects endogenous levels of total NFAT1.
RRID:
AB_2839141
Cite Format: Affinity Biosciences Cat# DF7189, RRID:AB_2839141.
Conjugate:
Unconjugated.
Purification:
The antiserum was purified by peptide affinity chromatography using SulfoLink™ Coupling Resin (Thermo Fisher Scientific).
Storage:
Rabbit IgG in phosphate buffered saline , pH 7.4, 150mM NaCl, 0.02% sodium azide and 50% glycerol. Store at -20 °C. Stable for 12 months from date of receipt.
Alias:

Fold/Unfold

AI607462; cytoplasmic 2; KIAA0611; NF ATc2; NF ATp; NF-ATc2; NF-ATp; NFAC2_HUMAN; NFAT 1; NFAT pre existing subunit; NFAT pre-existing subunit; NFAT transcription complex, preexisting component; NFAT1; NFAT1-D; NFATc2; NFATp; Nuclear factor of activated T cells cytoplasmic 2; Nuclear factor of activated T cells cytoplasmic calcineurin dependent 2; Nuclear factor of activated T cells pre-existing component; Nuclear factor of activated T cells, preexisting component; Nuclear factor of activated T-cells; Preexisting nuclear factor of activated T cells 2; T cell transcription factor NFAT 1; T-cell transcription factor NFAT1;

Immunogens

Immunogen:
Uniprot:
Gene(ID):
Expression:
Q13469 NFAC2_HUMAN:

Expressed in thymus, spleen, heart, testis, brain, placenta, muscle and pancreas. Isoform 1 is highly expressed in the small intestine, heart, testis, prostate, thymus, placenta and thyroid. Isoform 3 is highly expressed in stomach, uterus, placenta, trachea and thyroid.

Description:
This gene is a member of the nuclear factor of activated T cells (NFAT) family. The product of this gene is a DNA-binding protein with a REL-homology region (RHR) and an NFAT-homology region (NHR). This protein is present in the cytosol and only translocates to the nucleus upon T cell receptor (TCR) stimulation, where it becomes a member of the nuclear factors of activated T cells transcription complex. This complex plays a central role in inducing gene transcription during the immune response. Alternate transcriptional splice variants encoding different isoforms have been characterized.
Sequence:
MNAPERQPQPDGGDAPGHEPGGSPQDELDFSILFDYEYLNPNEEEPNAHKVASPPSGPAYPDDVLDYGLKPYSPLASLSGEPPGRFGEPDRVGPQKFLSAAKPAGASGLSPRIEITPSHELIQAVGPLRMRDAGLLVEQPPLAGVAASPRFTLPVPGFEGYREPLCLSPASSGSSASFISDTFSPYTSPCVSPNNGGPDDLCPQFQNIPAHYSPRTSPIMSPRTSLAEDSCLGRHSPVPRPASRSSSPGAKRRHSCAEALVALPPGASPQRSRSPSPQPSSHVAPQDHGSPAGYPPVAGSAVIMDALNSLATDSPCGIPPKMWKTSPDPSPVSAAPSKAGLPRHIYPAVEFLGPCEQGERRNSAPESILLVPPTWPKPLVPAIPICSIPVTASLPPLEWPLSSQSGSYELRIEVQPKPHHRAHYETEGSRGAVKAPTGGHPVVQLHGYMENKPLGLQIFIGTADERILKPHAFYQVHRITGKTVTTTSYEKIVGNTKVLEIPLEPKNNMRATIDCAGILKLRNADIELRKGETDIGRKNTRVRLVFRVHIPESSGRIVSLQTASNPIECSQRSAHELPMVERQDTDSCLVYGGQQMILTGQNFTSESKVVFTEKTTDGQQIWEMEATVDKDKSQPNMLFVEIPEYRNKHIRTPVKVNFYVINGKRKRSQPQHFTYHPVPAIKTEPTDEYDPTLICSPTHGGLGSQPYYPQHPMVAESPSCLVATMAPCQQFRTGLSSPDARYQQQNPAAVLYQRSKSLSPSLLGYQQPALMAAPLSLADAHRSVLVHAGSQGQSSALLHPSPTNQQASPVIHYSPTNQQLRCGSHQEFQHIMYCENFAPGTTRPGPPPVSQGQRLSPGSYPTVIQQQNATSQRAAKNGPPVSDQKEVLPAGVTIKQEQNLDQTYLDDVNEIIRKEFSGPPARNQT

Predictions

Predictions:

Score>80(red) has high confidence and is suggested to be used for WB detection. *The prediction model is mainly based on the alignment of immunogen sequences, the results are for reference only, not as the basis of quality assurance.

Species
Results
Score
Pig
100
Horse
100
Bovine
100
Dog
100
Chicken
100
Rabbit
100
Xenopus
88
Sheep
67
Zebrafish
0
Model Confidence:
High(score>80) Medium(80>score>50) Low(score<50) No confidence

PTMs - Q13469 As Substrate

Site PTM Type Enzyme
S23 Phosphorylation
S31 Phosphorylation Q86Y07 (VRK2)
Y36 Phosphorylation
Y38 Phosphorylation
S53 Phosphorylation Q05513 (PRKCZ)
S56 Phosphorylation Q05513 (PRKCZ)
K70 Ubiquitination
S73 Phosphorylation
S79 Phosphorylation
K96 Ubiquitination
S99 Phosphorylation
K102 Ubiquitination
S107 Phosphorylation
S110 Phosphorylation
T116 Phosphorylation
S148 Phosphorylation
R150 Methylation
S171 Phosphorylation
S172 Phosphorylation
S174 Phosphorylation
S175 Phosphorylation
S177 Phosphorylation
Y212 Phosphorylation
S213 Phosphorylation
S217 Phosphorylation
S221 Phosphorylation
S225 Phosphorylation
S230 Phosphorylation
S236 Phosphorylation
S243 Phosphorylation
S245 Phosphorylation
S247 Phosphorylation
S255 Phosphorylation
S268 Phosphorylation
S274 Phosphorylation
S276 Phosphorylation
S280 Phosphorylation
T325 Phosphorylation
S326 Phosphorylation
S330 Phosphorylation
S333 Phosphorylation
S337 Phosphorylation
K338 Ubiquitination
Y346 Phosphorylation
S363 Phosphorylation
S367 Phosphorylation
T374 Phosphorylation
K482 Ubiquitination
T483 Phosphorylation
T485 Phosphorylation
K491 Ubiquitination
K497 Ubiquitination
K520 Ubiquitination
K530 Ubiquitination
T585 Phosphorylation
T599 Phosphorylation
S605 Phosphorylation
T652 Phosphorylation
S736 Phosphorylation
S737 Phosphorylation
Y752 Phosphorylation
S755 Phosphorylation
S757 Phosphorylation
S759 Phosphorylation
S761 Phosphorylation
S776 Phosphorylation
S790 Phosphorylation
S801 Phosphorylation
S808 Phosphorylation
S814 Phosphorylation
S856 Phosphorylation
S859 Phosphorylation
Y860 Phosphorylation
S882 Phosphorylation
K885 Ubiquitination
T893 Phosphorylation
K895 Sumoylation
Y904 Phosphorylation

Research Backgrounds

Function:

Plays a role in the inducible expression of cytokine genes in T-cells, especially in the induction of the IL-2, IL-3, IL-4, TNF-alpha or GM-CSF. Promotes invasive migration through the activation of GPC6 expression and WNT5A signaling pathway.

PTMs:

In resting cells, phosphorylated by NFATC-kinase on at least 18 sites in the 99-363 region. Upon cell stimulation, all these sites except Ser-243 are dephosphorylated by calcineurin. Dephosphorylation induces a conformational change that simultaneously exposes an NLS and masks an NES, which results in nuclear localization. Simultaneously, Ser-53 or Ser-56 is phosphorylated; which is required for full transcriptional activity.

Ubiquitinated in endothelial cells by RNF213 downstream of the non-canonical Wnt signaling pathway, leading to its degradation by the proteasome.

Subcellular Location:

Cytoplasm. Nucleus.
Note: Cytoplasmic for the phosphorylated form and nuclear after activation that is controlled by calcineurin-mediated dephosphorylation. Rapid nuclear exit of NFATC is thought to be one mechanism by which cells distinguish between sustained and transient calcium signals. The subcellular localization of NFATC plays a key role in the regulation of gene transcription.

Extracellular region or secreted Cytosol Plasma membrane Cytoskeleton Lysosome Endosome Peroxisome ER Golgi apparatus Nucleus Mitochondrion Manual annotation Automatic computational assertionSubcellular location
Tissue Specificity:

Expressed in thymus, spleen, heart, testis, brain, placenta, muscle and pancreas. Isoform 1 is highly expressed in the small intestine, heart, testis, prostate, thymus, placenta and thyroid. Isoform 3 is highly expressed in stomach, uterus, placenta, trachea and thyroid.

Subunit Structure:

Member of the multicomponent NFATC transcription complex that consists of at least two components, a pre-existing cytoplasmic component NFATC2 and an inducible nuclear component NFATC1. Other members such as NFATC4, NFATC3 or members of the activating protein-1 family, MAF, GATA4 and Cbp/p300 can also bind the complex. The phosphorylated form specifically interacts with XPO1; which mediates nuclear export. NFATC proteins bind to DNA as monomers. Interacts with NFATC2IP (By similarity). Interacts with FOXP3. Interacts with TBX21 ('Thr-303' phosphorylated form) (By similarity). Interacts with KAT2A (By similarity). Interacts with HOMER2 and HOMER3; this interaction competes with calcineurin/PPP3CA-binding and hence prevents NFATC2 dephosphorylation and activation. Interacts with protein phosphatase PPP3CA/calcineurin A.

Family&Domains:

the 9aaTAD motif is a transactivation domain present in a large number of yeast and animal transcription factors.

Rel Similarity Domain (RSD) allows DNA-binding and cooperative interactions with AP1 factors.

Research Fields

· Cellular Processes > Cell growth and death > Cellular senescence.   (View pathway)

· Environmental Information Processing > Signal transduction > cGMP-PKG signaling pathway.   (View pathway)

· Environmental Information Processing > Signal transduction > Wnt signaling pathway.   (View pathway)

· Human Diseases > Infectious diseases: Viral > Hepatitis B.

· Human Diseases > Infectious diseases: Viral > HTLV-I infection.

· Organismal Systems > Development > Axon guidance.   (View pathway)

· Organismal Systems > Development > Osteoclast differentiation.   (View pathway)

· Organismal Systems > Immune system > Natural killer cell mediated cytotoxicity.   (View pathway)

· Organismal Systems > Immune system > Th1 and Th2 cell differentiation.   (View pathway)

· Organismal Systems > Immune system > Th17 cell differentiation.   (View pathway)

· Organismal Systems > Immune system > T cell receptor signaling pathway.   (View pathway)

· Organismal Systems > Immune system > B cell receptor signaling pathway.   (View pathway)

· Organismal Systems > Endocrine system > Oxytocin signaling pathway.

References

1). Reducing Nav1.6 expression attenuates the pathogenesis of Alzheimer's disease by suppressing BACE1 transcription. Aging Cell [IF=7.8]

Application: WB    Species: Mouse    Sample:

FIGURE 5 Aβ oligomer-induced expression levels of BACE1 and inactive NFAT1 by interference with Nav1.6, TTX, EGTA, and KB-R7943. Representative immunoblots (a) and densitometry analysis of P-NFAT1 (inactive) (b), NFAT1 (active) (c), BACE1 (d), and Nav1.6 (e) expression levels in SH-SY5Y cells after treatment with siNav1.6, 1 μM TTX, 0.5 mM EGTA, and 5 μM KB-R7943 under induced Aβ oligomers condition. (f) Relative mRNA expression of RT-qPCR showing the expression level of BACE1 in the SH-SY5Y cells after treatment with siNav1.6, 1 μM TTX, 0.5 mM EGTA, and 5 μM KB-R7943 under induced Aβ oligomers condition. (g) Intracellular calcium levels in SH-SY5Y cell after treatment with NC, siNav1.6, 1 μM TTX, 0.5 mM EGTA, and 5 μM KB-R7943 under induced Aβ oligomers condition. (h) SH-SY5Y cells were either treated with 1 μM TTX, 0.5 mM EGTA, and 5 μM KB-R7943 or transfected with Nav1.6 siRNA in the presence of Aβ oligomers and immunostained for NFAT1 and DAPI. Scale bar: 100 μm. (i) The ratio of nuclear NFAT1 to the cytoplasmic NFAT1. Here, P-NFAT1, BACE1, and Nav1.6 were normalized to γ-tubulin in the Western blot, whereas BACE1 was normalized to ACTIN in the RT-PCR. Data are presented as mean ± SEM. *p < 0.05, **p < 0.01, **p < 0.001. Representative immunoblots (j) and densitometry analysis (k) of Nav1.6, P-NFAT1, and NFAT1 protein expression in the brain of mice (WT and APP/PS1 treated with siNav1.6 or NC), n = 5 mice/group. (l) The proposed flowchart cycle depicting interference of Nav1.6’s effect on the progression of AD. Interference of Nav1.6 can reduce the Aβ oligomers-dependent transcription of BACE1, which then relieves intracellular calcium overload by inhibiting sodium-calcium reverse exchange channel and leads to an increase in non-activated NFAT1 expression levels. The reduced transcription of BACE1, in turn, decreases Aβ production and slows the progression of AD

Application: IF/ICC    Species: Mouse    Sample:

FIGURE 5 Aβ oligomer-induced expression levels of BACE1 and inactive NFAT1 by interference with Nav1.6, TTX, EGTA, and KB-R7943. Representative immunoblots (a) and densitometry analysis of P-NFAT1 (inactive) (b), NFAT1 (active) (c), BACE1 (d), and Nav1.6 (e) expression levels in SH-SY5Y cells after treatment with siNav1.6, 1 μM TTX, 0.5 mM EGTA, and 5 μM KB-R7943 under induced Aβ oligomers condition. (f) Relative mRNA expression of RT-qPCR showing the expression level of BACE1 in the SH-SY5Y cells after treatment with siNav1.6, 1 μM TTX, 0.5 mM EGTA, and 5 μM KB-R7943 under induced Aβ oligomers condition. (g) Intracellular calcium levels in SH-SY5Y cell after treatment with NC, siNav1.6, 1 μM TTX, 0.5 mM EGTA, and 5 μM KB-R7943 under induced Aβ oligomers condition. (h) SH-SY5Y cells were either treated with 1 μM TTX, 0.5 mM EGTA, and 5 μM KB-R7943 or transfected with Nav1.6 siRNA in the presence of Aβ oligomers and immunostained for NFAT1 and DAPI. Scale bar: 100 μm. (i) The ratio of nuclear NFAT1 to the cytoplasmic NFAT1. Here, P-NFAT1, BACE1, and Nav1.6 were normalized to γ-tubulin in the Western blot, whereas BACE1 was normalized to ACTIN in the RT-PCR. Data are presented as mean ± SEM. *p < 0.05, **p < 0.01, **p < 0.001. Representative immunoblots (j) and densitometry analysis (k) of Nav1.6, P-NFAT1, and NFAT1 protein expression in the brain of mice (WT and APP/PS1 treated with siNav1.6 or NC), n = 5 mice/group. (l) The proposed flowchart cycle depicting interference of Nav1.6’s effect on the progression of AD. Interference of Nav1.6 can reduce the Aβ oligomers-dependent transcription of BACE1, which then relieves intracellular calcium overload by inhibiting sodium-calcium reverse exchange channel and leads to an increase in non-activated NFAT1 expression levels. The reduced transcription of BACE1, in turn, decreases Aβ production and slows the progression of AD

2). Dehydroepiandrosterone attenuates pulmonary artery and right ventricular remodeling in a rat model of pulmonary hypertension due to left heart failure. LIFE SCIENCES (PubMed: 30605649) [IF=6.1]

Application: WB    Species: rat    Sample: lung

Fig. 6. |DHEA suppressed STAT3/NFAT signal pathway in lung. A, PY750-STAT3 and STAT3; B, NFATc2; C, Pim-1; D, Survivin. The top shows representative immunoblots, and the bottom shows the densitometric assessment. The values are means ± SE, n = 5 rats per group; *P < 0.05 versus the sham group, #P < 0.05 versus the PH-LHF group.

3). Effects and Mechanisms of Rhus chinensis Mill. Fruits on Suppressing RANKL-Induced Osteoclastogenesis by Network Pharmacology and Validation in RAW264.7 Cells. Nutrients (PubMed: 35267996) [IF=5.9]

Application: WB    Species:    Sample: RAW264.7 cells

Figure 9.| Effects of the ethanolic extract from the R. chinensis fruits on RANKL-induced osteoclastogenesis on c-Fos and NFATc1 proteins in RAW264.7 cells. (a) Western blot analysis of c-Fos and proteins

4). Wnt5a regulates Ameloblastoma Cell Migration by modulating Mitochondrial and Cytoskeletal Dynamics. Journal of Cancer (PubMed: 32742496) [IF=3.9]

Application: WB    Species: human    Sample: AM-1 cells

Figure 5. |Wnt5a up-regulates mitochondria-cytoskeleton co-localization through mediating Coro1A expression. (A) Western blot detected nuclear transfactor NFATc2 and Coro1A protein expression. Bar charts demonstrating quantitative significance results from 3 to 5 independent experiments. (B) Western blot demonstrating Coro1A protein expression changes of AM-1 cells treated with only human recombinant Wnt5a compared with cells in the presence of both rhWnt5a and FK506 (200 nm).

Restrictive clause


Affinity Biosciences tests all products strictly. Citations are provided as a resource for additional applications that have not been validated by Affinity Biosciences. Please choose the appropriate format for each application and consult Materials and Methods sections for additional details about the use of any product in these publications.

For Research Use Only.
Not for use in diagnostic or therapeutic procedures. Not for resale. Not for distribution without written consent. Affinity Biosciences will not be held responsible for patent infringement or other violations that may occur with the use of our products. Affinity Biosciences, Affinity Biosciences Logo and all other trademarks are the property of Affinity Biosciences LTD.