![Phospho-PI3K p85 (Tyr458)[Tyr467]/p55 (Tyr199) Antibody - Western blot analysis of lysates from COLO205 cells, using Phospho-PI3K p85 (Tyr458)[Tyr467]/p55 (Tyr199) Antibody at 1/1000 dilution.](http://img.affbiotech.cn/images/202606/af3242_74627_phospho_pi3k_p85_tyr458_tyr467_p55_tyr199_antibody_1782457882.jpg "Western blot analysis of lysates from COLO205 cells, using Phospho-PI3K p85 (Tyr458)[Tyr467]/p55 (Tyr199) Antibody at 1/1000 dilution.
5ug/NC membrane strip.
Exposure for 4min with Affinity™ ECL Kit(#KF8003).
Bands result from membrane strip incubation.")
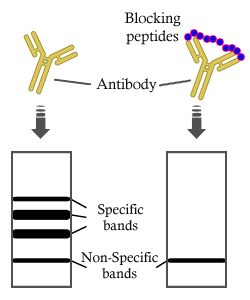
![Phospho-PI3K p85 (Tyr458)[Tyr467]/p55 (Tyr199) Antibody - peptide-ELISA analysis of AF3242.](http://img.affbiotech.cn/images/pelisa/809/af3242-peptide-elisa.png "peptide-ELISA analysis of AF3242. showing specificity to antigen peptide. Peptides concentration: 1ug/ml.<br>
P-peptide: phospho-peptide. N-peptide: non-phospho-peptide.")
![Phospho-PI3K p85 (Tyr458)[Tyr467]/p55 (Tyr199) Antibody - Treatment with angelicin alters the protein expression levels of PI3K, p-Akt and total Akt in HepG2 and Huh-7 cells in vitro.](http://img.affbiotech.cn/images/cited_image/202111/28849216_20180918231825.jpg "Treatment with angelicin alters the protein expression levels of PI3K, p-Akt and total Akt in HepG2 and Huh-7 cells in vitro. (A) Representative blots demonstrating PI3K, p-Akt and total Akt protein expression levels in HepG2 and Huh-7 cells, following treatment with various concentrations of angelicin. (B) PI3K blots were semi-quantified using densitometry analysis of the protein bands and normalized to GAPDH. (C) p-Akt/Akt blots were semi-quantified using densitometry analysis of the protein bands. (D) Effects of LY294002 on angelicin-induced apoptosis. Cells were treated with the PI3K inhibitor LY294002 (3 mM) for 1 h prior to treatment with angelicin. The percentage of apoptotic cells following treatment with angelicin in the presence or absence of LY294002 was assessed using Annexin V-fluorescein isothiocyanate/propidium iodide staining and flow cytometry. Data are expressed as the mean ± standard deviation of 3 independent experiments.")
![Phospho-PI3K p85 (Tyr458)[Tyr467]/p55 (Tyr199) Antibody - Fig.](http://img.affbiotech.cn/images/cited_image/202110/cited_img_332.jpg "Fig. 5| ACT001 inhibits glioma cells through the PI3K/AKT signalling pathway.f The PI3K/AKT pathway was detected in glioma cells before (Con) and 24 h after PAI-039 treatment at the indicated concentrations.The results were obtained from three independent experiments, and each experiment was performed in triplicate. Data are represented as the mean ± standard error of the mean (*P < 0.05, **P < 0.01)")
![Phospho-PI3K p85 (Tyr458)[Tyr467]/p55 (Tyr199) Antibody - Fig.](http://img.affbiotech.cn/images/cited_image/202110/cited_img_333.jpg "Fig. 7| ACT001 enhances the antitumour effect of cisplatin in vivo. a Xenograft assays in the mice treated with control, ACT001, cisplatin and ACT001 + cisplatin. b Tumour volume changes in the mice treated with control, ACT001, cisplatin and ACT001 + cisplatin. c Body weight changes in the mice treated with control, ACT001, cisplatin and ACT001 + cisplatin. d IHC analysis of the PI3K, p-PI3K, AKT and p-AKT levels. Compared with the control group, the staining of p-PI3K and p-AKT was lighter in the ACT001 treatment groups. In the ACT001 + cisplatin treatment group, the staining of p-PI3K and p-AKT was lighter than in the ACT001-treated group.")
![Phospho-PI3K p85 (Tyr458)[Tyr467]/p55 (Tyr199) Antibody - Figure 5.](http://img.affbiotech.cn/images/cited_image/202110/cited_img_432.jpg "Figure 5. |PI3K/AKT signaling is involved in IBSP-regulated osteoblast differentiation(A)Transfection of agomiRNA-92a-3p, antagomiRNA-92a-3p, agomiRNA-NC, antagomiRNA-NC, and Lipofectamine 3000 control (200 mm) in MC3T3-E1 cells for 48 h.Western blot detection of the expression of PI3K and AKT after transfection.")
![Phospho-PI3K p85 (Tyr458)[Tyr467]/p55 (Tyr199) Antibody - Fig.](http://img.affbiotech.cn/images/cited_image/202203/cite-wx-1421-1646988863.jpg "Fig. 5| AA treatment activated the AMPK and inhibited PI3K/AKT signaling pathway. The cells were treated with or without AA (5 μM) for 3 days. aRepresentative western blot of p-AMPK, AMPK, p-PI3K, PI3K, p-AKT, and AKT. GAPDH was served as a loading control.")
![Phospho-PI3K p85 (Tyr458)[Tyr467]/p55 (Tyr199) Antibody - FIGURE 5 |Effect of CT and DOX on the hepatic protein of PI3K/Akt signaling pathway in rats.](http://img.affbiotech.cn/images/cited_image/202205/cite-wx-1938-1653276331.jpg "FIGURE 5 |Effect of CT and DOX on the hepatic protein of PI3K/Akt signaling pathway in rats. A, Immunohistochemistry staining of p‐PI3K in liver tissues.")
![Phospho-PI3K p85 (Tyr458)[Tyr467]/p55 (Tyr199) Antibody - Fig.](http://img.affbiotech.cn/images/cited_image/202206/cite-wx-1984-1655108163.jpg "Fig. 7 |Protein expression of p-IRS1, p-PI3, p-AKT, klotho, and p53; immunofluorescence image of p-IRS-1 in gastrocnemius after vibration for 12 weeks.")
![Phospho-PI3K p85 (Tyr458)[Tyr467]/p55 (Tyr199) Antibody - Fig.](http://img.affbiotech.cn/images/cited_image/202207/cite-wx-270-1659081785.jpg "Fig. 5
AA treatment activated the AMPK and inhibited PI3K/AKT signaling pathway. The cells were treated with or without AA (5 μM) for 3 days. a Representative western blot of p-AMPK, AMPK, p-PI3K, PI3K, p-AKT, and AKT. GAPDH was served as a loading control. b Relative protein expression of p-AMPK/AMPK, p-PI3K/PI3K, and p-AKT/AKT. Unpaired t test, *P < 0.05, ***P < 0.001. Each experiment was repeated three times (p-AMPK, phosphorylated AMP-activated protein kinase; AMPK, AMP-activated protein kinase; p-PI3K, phosphorylated phosphoinositide-3 kinase; PI3K, phosphoinositide-3 kinase; p-AKT, phosphorylated protein kinase B; AKT, protein kinase B)")
![Phospho-PI3K p85 (Tyr458)[Tyr467]/p55 (Tyr199) Antibody - Fig.](http://img.affbiotech.cn/images/cited_image/202207/cite-wx-378-1659081785.jpg "Fig. 8. MiR-152-3p/DNMT1/PTEN pathway affected the cellular progress via modulating the AKT/Ampk signaling pathway in BCa.
(A-B) qPCR and western blot analysis of efficiency of PTEN over-expression in T24 and J82 cells. (C-D) CCK8 analysis of the cell viability in T24 and J82 cells. (E-F)
EdU and Transwell analysis of the cell proliferation and migration in T24 and J82 cells. (G-J) Quantitative analysis of EdU and Transwell in T24 and J82 cells. (K)
western blot analysis of the PI3K/p-AKT signaling pathway in T24 and J82 cells.
For C-K, T24 and J82 cells were divided into four groups: pCDH-PTEN + pcDH-DNMT1 + miR-152-3p mimics, pCDH-DNMT1 + miR-152-3p mimics, pCDHNC + miR-152-3p mimics and pCDH-NC + mimics NC respectively about 48 h. β-Actin was measured as internal control of qPCR analysis. Experiments repeated
three times. The *P < 0.05 and **P < 0.01in a two-tailed Student's t-test.")
![Phospho-PI3K p85 (Tyr458)[Tyr467]/p55 (Tyr199) Antibody - Figure 4
miR-15b impairs the activation of PI3K/AKT signalling pathway in oesophageal cancer.](http://img.affbiotech.cn/images/cited_image/202208/cite-wx-485-1659690101.jpg "Figure 4
miR-15b impairs the activation of PI3K/AKT signalling pathway in oesophageal cancer. The effect of miR-15b on the PI3K/AKT signalling pathway was investigated via western blotting. p-PI3K/PI3K and p-AKT/AKT ratios in (A) EC109 and (B) TE10 cells. **P<0.01 vs. mimics NC; ##P<0.01 vs. inhibitor NC. miR, microRNA; p, phosphorylated; NC, negative control.")
![Phospho-PI3K p85 (Tyr458)[Tyr467]/p55 (Tyr199) Antibody - Figure 5
PI3K/AKT signaling is involved in IBSP-regulated osteoblast differentiation
(A) Transfection of agomiRNA-92a-3p, antagomiRNA-92a-3p, agomiRNA-NC, antagomiRNA-NC, and Lipofectamine 3000 control (200 μm) in MC3T3-E1 cells for 48 h.](http://img.affbiotech.cn/images/cited_image/202208/cite-wx-756-1661496481.jpg "Figure 5
PI3K/AKT signaling is involved in IBSP-regulated osteoblast differentiation
(A) Transfection of agomiRNA-92a-3p, antagomiRNA-92a-3p, agomiRNA-NC, antagomiRNA-NC, and Lipofectamine 3000 control (200 μm) in MC3T3-E1 cells for 48 h. Western blot detection of the expression of PI3K and AKT after transfection. (B) Western blot detection of IBSP, p-PI3K, and p-AKT levels after transfection with siRNA-NC, siRNA-IBSP, and controls for 48 h. (C–G) Transfection with Lipofectamine 3000, siRNA-NC, siRNA-PI3K, or siRNA-AKT for 48 h. (C) Protein-expression levels of p-AKT, AKT, p-PI3K, and p-PI3K using western blotting. (D–G) qPCR analysis of Col1a1 (D), ALP (E), OCN (F), and Runx2 (G) expression in bone precursor cells. (H) Western blot analysis of Col1a1, ALP, OCN, and Runx2 levels 48 h after transfection. (I) Alizarin red staining of MC3T3-E1 cells 3 weeks after transfection. (J) ALP staining of MC3T3-E1 cells 2 weeks after transfection. n = 3; data are presented as mean ± SD (∗p < 0.05; ∗∗p < 0.01; ∗∗∗p < 0.001; # no significance).")
![Phospho-PI3K p85 (Tyr458)[Tyr467]/p55 (Tyr199) Antibody - Figure 7
LXA4 suppresses the activation of the PI3K/AKT pathway induced by PQ.](http://img.affbiotech.cn/images/cited_image/202208/cite-wx-770-1661496481.jpg "Figure 7
LXA4 suppresses the activation of the PI3K/AKT pathway induced by PQ. Western blot analysis was performed to detect the protein levels of total-PI3K, p-PI3K, total AKT and p-AKT in (A and B) rat lung tissues and (C and D) RAW264.7 cells. Data are presented as the means ± SD (n=10 in vivo, n=6 in vitro). #P<0.05 vs. the CON group. *P<0.05 vs. the PQ group. ns, ns1, ns3, not significant (P>0.05) vs. the CON group; ns2, not significant (P>0.05) vs. the PQ group. LXA4, lipoxin A4; PQ, paraquat.")
![Phospho-PI3K p85 (Tyr458)[Tyr467]/p55 (Tyr199) Antibody - Fig.](http://img.affbiotech.cn/images/cited_image/202208/cite-wx-786-1661496481.jpg "Fig. 7 GXB activated the PI3K/Akt/eNOS signaling in CEPCs of T2DM-AMI rats. (A) Western-blot analysis of total and phosphorylated PI3K, Akt, and eNOS in CEPCs from each group; GAPDH was used as an internal reference protein. (B) Ratio of
phosphorylated/total PI3K, Akt, and eNOS in EPCs from the indicated groups. (C) The relative expression of Pi3k, Akt and eNos
mRNA changes in CEPCs from the different groups. Data were shown as mean ± SD (n = 8). Δ
P < 0.05, ΔΔP < 0.01 vs control; *
P <
0.05, **P < 0.01 vs model")
![Phospho-PI3K p85 (Tyr458)[Tyr467]/p55 (Tyr199) Antibody - Figure 5.](http://img.affbiotech.cn/images/cited_image/202209/cite-wx-1075-1662714320.jpg "Figure 5.
Effect of ivabradine on AKT/mTOR/p70S6K pathway of MI rats. (a) Representative WB bands of p-PI3K, PI3K, AKT and p-AKT. Quantification of p-PI3K (b) and PI3K (c), as normalized to β-actin. (d) Representative WB bands of mTOR, p-mTOR, p70S6K and p-p70S6K. Quantification of p-PI3K (e) and PI3K (f), as normalized to β-actin. n = 6 hearts/group. Data were expressed as mean ± SD; ##P < 0.01 vs Sham group; **P < 0.01 vs MI group; &P < 0.05 vs MI+Iva group. Abbreviations: 3-MA, 3-methyladenine; Iva, ivabradine; MI, myocardial infarction; Rap, rapamycin")
![Phospho-PI3K p85 (Tyr458)[Tyr467]/p55 (Tyr199) Antibody - Figure 5
Sorafenib efficiency improves after Y-box binding protein 1 knockdown in vivo.](http://img.affbiotech.cn/images/cited_image/202209/cite-wx-1127-1664180081.jpg "Figure 5
Sorafenib efficiency improves after Y-box binding protein 1 knockdown in vivo. A: The morphologies of collected tumors in subcutaneous Huh7 xenografts in nude mice; B: Tumor growth curves; C: Tumor weights were measured after collection; D: Hematoxylin-eosin (HE) and immunohistochemical staining for proliferating cell nuclear antigen; E, F: Western blot analysis showed Y-box binding protein 1 (YB-1), phosphorylated protein kinase B (p-Akt), protein kinase B (Akt), phosphorylated phosphoinositide-3-kinase (p-PI3K), and phosphoinositide-3-kinase (PI3K) expression in cells infected with lentivirus encoding non-specific short hairpin RNA as a negative control (Lv-shNC) ± sorafenib vs lentivirus containing short hairpin RNA targeting YB-1 (Lv-shYB-1) ± sorafenib groups. p-Akt (normalized to Akt) and p-PI3K (normalized to PI3K) protein levels were measured by scanning densitometry. Protein samples derived from the same experiment and gels were processed in parallel. aP < 0.05, bP < 0.01, cP < 0.001 vs the indicated groups. PCNA: Proliferating cell nuclear antigen.")
![Phospho-PI3K p85 (Tyr458)[Tyr467]/p55 (Tyr199) Antibody - Figure 3.](http://img.affbiotech.cn/images/cited_image/202210/cite-wx-1400-1666341971.jpg "Figure 3.
miR-106a-5p downregulated FOXC1 expression via targeting 3ʹUTR of FOXC1. (a) The sequence alignment of FOXC1 binding to miR-106a-5p. (b) Luciferase reporter assay was performed to evaluate the binding activity between FOXC1 and miR-106a-5p. One-way ANOVA. **p < 0.01. (c) The FOXC1 expression in ESCs with miR-106a-5p mimic transfected was examined using RT-qPCR. One-way ANOVA. **p < 0.01, ns: not-significant. (d, e) The detection and quantification of FOXC1, the p-PI3K, p-AKT, and p-mTOR in ESCs with miR-106a-5p mimic transfected using western blot assay. β-actin was conducted as a loading control. One-way ANOVA. **p < 0.01, ns: not-significant")
![Phospho-PI3K p85 (Tyr458)[Tyr467]/p55 (Tyr199) Antibody - FIGURE 4
Liver fibrosis‐related protein expressions under Smad2/3, PI3K/Akt inhibitors in LX‐2 cells (A‐D) Western blot analysis showed the protein expressions of α‐SMA, collagen I, p‐Smad2, p‐Smad3, Samd2/3, p‐PI3K, PI3K, p‐Akt and Akt in control, SIS3/LY294002, sTREM‐1 and sTREM‐1+SIS3/LY294002 groups of LX‐2 cells.](http://img.affbiotech.cn/images/cited_image/202211/cite-wx-1507-1667554065.jpg "FIGURE 4
Liver fibrosis‐related protein expressions under Smad2/3, PI3K/Akt inhibitors in LX‐2 cells (A‐D) Western blot analysis showed the protein expressions of α‐SMA, collagen I, p‐Smad2, p‐Smad3, Samd2/3, p‐PI3K, PI3K, p‐Akt and Akt in control, SIS3/LY294002, sTREM‐1 and sTREM‐1+SIS3/LY294002 groups of LX‐2 cells. ns: not significant, * p < 0.05, ** p < 0.01")
![Phospho-PI3K p85 (Tyr458)[Tyr467]/p55 (Tyr199) Antibody - Fig.](http://img.affbiotech.cn/images/cited_image/202211/cite-wx-1546-1668760631.jpg "Fig. 4
Effect of acacetin on the phosphorylation levels of PI3K and Akt in TGF-β1 (10 ng/ml)-treated GC cells. A Western blot analysis of the phosphorylation of PI3K and Akt in GC cells treated with acacetin. B GC cells were treated with TGF-β1 (10 ng/ml) in the absence or presence of acacetin. The quantitative values are expressed as the mean ± SD of three independent experiments. * p < 0.05, ** p < 0.01, *** p < 0.001 compared to the control group. # p < 0.05, ## p < 0.01 compared to the TGF-β1 alone group")
![Phospho-PI3K p85 (Tyr458)[Tyr467]/p55 (Tyr199) Antibody - Figure 3
Effects of different doses of FJD on the Bcl-2 family protein (a) and the PI3K/AKT/mTOR/NF-κB (b) signaling pathway of protein levels in tumor tissues.](http://img.affbiotech.cn/images/cited_image/202211/cite-wx-1648-1668761351.jpg "Figure 3
Effects of different doses of FJD on the Bcl-2 family protein (a) and the PI3K/AKT/mTOR/NF-κB (b) signaling pathway of protein levels in tumor tissues. Data was expressed as mean ± SD. Compared with the model group, ★P < 0.05, ★★P < 0.01.")
![Phospho-PI3K p85 (Tyr458)[Tyr467]/p55 (Tyr199) Antibody - Figure 3
Effects of solasonine on cell proliferation, apoptosis, cell cycle arrest, and the expression of genes in tumor-related pathways in BC cells.](http://img.affbiotech.cn/images/cited_image/202211/cite-wx-1675-1668761351.jpg "Figure 3
Effects of solasonine on cell proliferation, apoptosis, cell cycle arrest, and the expression of genes in tumor-related pathways in BC cells. (a) T24 and 5637 cells were treated with various concentrations of solasonine for 48 h, and the cell viability was evaluated by CCK8 assay. The doses of 50 and 80 μM solasonine were selected for T24 and 5637 cells in subsequent experiments, respectively. (b) CCK8 assay revealed that solasonine significantly reduced the proliferation of BC cells in a time-dependent manner. (c) Apoptosis assay and quantitation of apoptotic cells showed that solasonine significantly promoted apoptosis in BC cells. (d) Flow cytometric analysis showed that solasonine affected cell cycle progression. (e) Western blot showed changes of molecules in the MAPK and PI3K/AKT signaling pathways, EGFR and VEGFA protein expression in T24 and 5637 BC cells after solasonine treatment. Three independent experiments were conducted for each assay, and data are presented as the mean ± standard error of the mean. ∗P < 0.05, ∗∗P < 0.01, and ∗∗∗P < 0.001 vs. the control group.")
![Phospho-PI3K p85 (Tyr458)[Tyr467]/p55 (Tyr199) Antibody - Figure 5.](http://img.affbiotech.cn/images/cited_image/202211/cite-wx-1780-1669368078.jpg "Figure 5.
MiR-107 overexpression suppressed the PI3K/Akt signaling pathway in FaDu cells. (a) After transfection for 48 h, the protein levels of p-PI3K, PI3K, p-Akt, and Akt were evaluated.")
![Phospho-PI3K p85 (Tyr458)[Tyr467]/p55 (Tyr199) Antibody - Figure 4
Dex inhibited the activities of PI3K/AKT signaling pathways in MC3T3-E1 cells.](http://img.affbiotech.cn/images/cited_image/202212/cite-wx-299-1671782324.jpg "Figure 4
Dex inhibited the activities of PI3K/AKT signaling pathways in MC3T3-E1 cells.
(A–B) Western blotting was performed to analyze the expression levels of PI3K, p-PI3K, AKT, p-AKT, FOXO1, and p-FOXO1 in MC3T3-E1 cells after Dex treatment (200 µM, 48 h). Con: control group. All data in vivo and in vitro experiments are triplicate biological replicates. * P < 0.05, ** P < 0.01, *** P < 0.0001.")
![Phospho-PI3K p85 (Tyr458)[Tyr467]/p55 (Tyr199) Antibody - Fig.](http://img.affbiotech.cn/uploads/202309/5a82e7c7d1d4b28b6c3c389b294519dd.png "Fig. 5. GEN activated autophagy by inhibiting PI3K activity. The proteins expression of PI3K (A, B), P-PI3K (A, C), AKT (A, D), P-AKT (A, E), mTOR (A, F), P-mTOR (A, G), P62 (A, H), LC3-II/I (A, I), Beclin-1 (A, J), and cleaved caspase3 (A, K) in DEX-treated MC3T3-E1 cells were determined by western blot. (L, M) The apoptosis was determined by a flow cytometer.")
![Phospho-PI3K p85 (Tyr458)[Tyr467]/p55 (Tyr199) Antibody - Figure 5 Showing how MT uses the PI3K/AKT/GSK-3β/P70S6k signaling pathway to treat iron-overloaded MC3T3-E1 cells.](http://img.affbiotech.cn/uploads/202309/380580527f3d7f4157cf48777118315c.png "Figure 5 Showing how MT uses the PI3K/AKT/GSK-3β/P70S6k signaling pathway to treat iron-overloaded MC3T3-E1 cells. (a) All mRNA expression levels in MC3T3-E1 cells were determined by using RT-PCR for p-PI3K, p-GSK-3β, p-AKT, and p-P70S6k. (b) Western blotting was used to analyze the expression of PI3K, AKT, GSK-3β, P70S6k, p-PI3K, p-AKT, p-GSK-3β, p-P70S6k, and β-actin proteins in MC3T3-E1 cells across treatment groups. MT stands for melatonin group; FAC+MT+LY294002 stands for the ferric ammonium citrate+melatonin+LY294002 group; PI3K stands for phosphatidylinositol kinase; p-PI3K stands for phosphorylated phosphatidylinositol kinase; AKT stands for protein kinase B; p-AKT stands for phosphorylated protein kinase B; p-GSK-3β stands for phosphorylated glycogen synthase kinase-3β; GSK-3β stands for glycogen synthase kinase-3β; P70S6 stands for ribosomal S6 protein kinase; p-P70S6k stands for phosphorylated ribosomal S6 protein kinase;")
![Phospho-PI3K p85 (Tyr458)[Tyr467]/p55 (Tyr199) Antibody - Figure 3 AS-IV inhibits the PI3K/Akt/mTOR pathway in lung tissues from rats exposed to PM2.](http://img.affbiotech.cn/uploads/202311/ac334b48909702a33a25d1e955364d64.png "Figure 3 AS-IV inhibits the PI3K/Akt/mTOR pathway in lung tissues from rats exposed to PM2.5. (A–D) The levels of p-PI3K, PI3K, p-AKT, AKT, p-mTOR, and mTOR were determined by Western blot analysis. (E) Effects of p-PI3K, p-AKT, and p-mTOR expression in lung tissues by immunohistochemistry staining. (Magnification 200×, Scale bar = 50 μm). (F) Statistical chart of positive expression of p-PI3K, p-AKT, and p-mTOR proteins. Graphs represent mean±SEM (n=6-7). ##P")
![Phospho-PI3K p85 (Tyr458)[Tyr467]/p55 (Tyr199) Antibody - Figure 3 AS-IV inhibits the PI3K/Akt/mTOR pathway in lung tissues from rats exposed to PM2.](http://img.affbiotech.cn/uploads/202311/e199be07df676386d7b97d6f12f0fe3d.png "Figure 3 AS-IV inhibits the PI3K/Akt/mTOR pathway in lung tissues from rats exposed to PM2.5. (A–D) The levels of p-PI3K, PI3K, p-AKT, AKT, p-mTOR, and mTOR were determined by Western blot analysis. (E) Effects of p-PI3K, p-AKT, and p-mTOR expression in lung tissues by immunohistochemistry staining. (Magnification 200×, Scale bar = 50 μm). (F) Statistical chart of positive expression of p-PI3K, p-AKT, and p-mTOR proteins. Graphs represent mean±SEM (n=6-7). ##P")
![Phospho-PI3K p85 (Tyr458)[Tyr467]/p55 (Tyr199) Antibody - FIGURE 5 CTSS deficiency ameliorated stress-related metabolic molecular alterations.](http://img.affbiotech.cn/uploads/202311/6cb09561c2aa260f22dc5fdffdb588e0.png "FIGURE 5 CTSS deficiency ameliorated stress-related metabolic molecular alterations. (A) Representative immunoblotting images and quantitative data for p-PI3K, p-Akt, p-FoxO3ɑ, MAFbx, MuRF-1, PI3K, Akt, FoxO3ɑ and GAPDH in gastrocnemius muscles at Day 14 after stress (n = 4). Data are mean ± SEM, and p-values were determined by a one-way ANOVA followed by Bonferroni post hoc tests. CW: CTSS+/+ control mice; CK: CTSS−/− control mice; SW: 14-day-stressed CTSS+/+ mice; SK: 14-day-stressed CTSS−/− mice. *p")
![Phospho-PI3K p85 (Tyr458)[Tyr467]/p55 (Tyr199) Antibody - FIGURE 12 Effects of knockdown of Budding uninhibited by benzimidazoles 1 (BUB1) on lung adenocarcinoma cell invasion and migration and changes in related protein expression.](http://img.affbiotech.cn/uploads/202311/ab7a5197c0a2bb891669a09637330912.png "FIGURE 12 Effects of knockdown of Budding uninhibited by benzimidazoles 1 (BUB1) on lung adenocarcinoma cell invasion and migration and changes in related protein expression. (A–D) Transwell assay showed that the migration and invasion ability of H1299 and H1975 cells were decreased after knockdown of BUB1. (E) Changes in the expression levels of E-cadherin, CyclinB1, and N-cadherin after knockdown of BUB1. (F) Changes in the expression levels of key proteins in the PI3K/AKT signaling pathway after knockdown of BUB1 (*p")
![Phospho-PI3K p85 (Tyr458)[Tyr467]/p55 (Tyr199) Antibody - Figure 2 RBG blocks the PI3K/AKT signaling pathway in MM cells.](http://img.affbiotech.cn/uploads/202311/0e505f7a55d09f518ed83ae329de0bef.png "Figure 2 RBG blocks the PI3K/AKT signaling pathway in MM cells. RPMI8226 cells were treated with different concentrations of RBG (2, 4 and 8 µM). The protein expression of AKT, p-AKT, PI3K and p-PI3K were detected using western blotting. *P")
![Phospho-PI3K p85 (Tyr458)[Tyr467]/p55 (Tyr199) Antibody - Fig.](http://img.affbiotech.cn/uploads/202311/8182aae07f518ed968adbc757f6854ad.png "Fig. 6 Mfn2 mediated inactivation of the phosphoinositide 3-kinase (PI3K)/AKT/mammalian target of rapamycin (mTOR) involved in the pro-autophagic effect of Morinda officinalis oligosaccharides. A Mfn2 expression was determined by quantitative polymerase chain reaction (qPCR) and western blotting. B The PI3K/Akt/mTOR pathway-related protein levels were determined by western blotting. C Fluorescent localization of the autophagosome (yellow) and autolysosome (red) using the GFP-mRFP-LC3 probe. D Autophagy-related protein levels, including LC3 and p62, were determined by western blotting. Data are shown as the mean ± standard deviation of three independent experiments. *p")
![Phospho-PI3K p85 (Tyr458)[Tyr467]/p55 (Tyr199) Antibody - Fig.](http://img.affbiotech.cn/uploads/202311/8a865b04ac46a6bcfec2e4b8ca250ecd.png "Fig. 3 BV enhances VEGFA secretion and angiogenesis via activating PI3K/AKT/mTOR pathway. A The expression of PI3K/AKT/mTOR pathway members were detected by western blot in HCT116 and SW480 treated with or without BV. B Western blot analysis of PI3K/AKT/mTOR pathway members with or without the treatment of BV, LY294002 and Rapamycin in HCT116. C The concentration of VEGFA in the culture medium of control and BV treated HCT116 and SW480 cells with or without the absence of LY294002 and Rapamycin. D HUVEC migration and tube formation in representative images in the CM of HCT116 cocultured with BV with or without the absence of LY294002 and Rapamycin. Scale bar, 50 μm and 100 μm respectively. The migrated HUVEC numbers and increasing folds of tube formation are shown in the bar graph.")
![Phospho-PI3K p85 (Tyr458)[Tyr467]/p55 (Tyr199) Antibody - Fig.](http://img.affbiotech.cn/uploads/202311/58b47d441abfb14db786685972282721.png "Fig. 6. Sipeimine pre-treatment increased the phosphorylation of PI3K/Akt in PM2.5-induced lung injury. (A-B) The p-PI3K, PI3K, p-Akt, and Akt expression were determined by western blot analysis based on the network pharmacology prediction. (C-D) Western blotting analysis of p-PI3K, PI3K, p-Akt, Akt, Nrf2, GPX4, and HO-1. (E) Immunofluorescence staining of Nrf2 and p-Akt in lung tissues. Bar = 100 µm, magnification 200 × . (F) Lung injury was assessed by H&E staining. Bar = 50 µm, magnification 100 × for the upper row and 200 × for the lower row, n = 4. Green arrows for inflammatory exudate; yellow arrows for hemorrhage; black arrows for inflammatory infiltration. (G) TEM was utilized to visualize mitochondrial changes of ferroptosis in type II alveolar epithelial cells (mitochondria, Mi; nuclear, N). Bar = 2 µm, magnification 2000 × for the upper row and 25000 × for the lower row, n = 4. Red arrows for decreased mitochondrial cristae and increased mitochondrial electron density in ferroptosis. The values are expressed as the means ± SEM (n = 7). *P")
![Phospho-PI3K p85 (Tyr458)[Tyr467]/p55 (Tyr199) Antibody - Figure 4.](http://img.affbiotech.cn/uploads/202311/132dfc68fa72c317d4eb4083dc944b1a.png "Figure 4. LINC01060 exerts its functions on osteosarcoma cells through the PI3K/Akt signaling. Note: (a-c) U2OS cells were transfected with lv-shLINC01060-1 and examined for PI3K and Akt mRNA expression using qRT-PCR and the protein levels of p-PI3K, PI3K, p-Akt, and Akt using Immunoblotting. N = 3; ** P")
![Phospho-PI3K p85 (Tyr458)[Tyr467]/p55 (Tyr199) Antibody - Fig.](http://img.affbiotech.cn/uploads/202401/6300aea05940b781f461583a35f0d5b7.png "Fig. 6. Combination treatment of DBD and EPCs reduce the apoptosis of endothelial cells by activating the PI3K/Akt/BAD pathway in rats with FCI. (A-I, n = 4) (A) TUNEL staining. (B) The percentage area of TUNEL-positive cells. (C) The protein expression of p-PI3K, PI3K, p-AKt, AKt, p-BAD, Bcl-2 and Bax in the cerebral cortex. Analysis of the ratio of (D) p-PI3K/PI3K (E) p-AKt/AKt, (F) p-BAD/actin, (G) Bcl-2/Bax (H) Bcl-2/actin and (I) Bax/actin. The data were presented as the mean ± SEM. #p<0.05, ##p<0.01, ###p<0.001 versus model group and & p<0.05, && p<0.01, &&& p<0.001 versus the EPCs group.")
![Phospho-PI3K p85 (Tyr458)[Tyr467]/p55 (Tyr199) Antibody - Fig.](http://img.affbiotech.cn/uploads/202402/1fc2799876b273c57f986d32fb11eddb.png "Fig. 6 Effect of LiCl and SC79 pretreatment on PI3K/Akt/Gsk3β signaling pathway and apoptosis related protein expression in Prx II knockdown HaCaT cells. A–D Analysis of expression levels of p-PI3K/PI3K, p-Akt/Akt and p-Gsk3β/Gsk3β by western blotting by H2O2 treatment for 1 h. E–H Analysis of expression levels of p-Gsk3β/Gsk3β, Bax/Bcl-2 and cle-Cas3/pro-Cas3 by western blotting pre-treated with Licl for 1 h, followed by H2O2 treatment for 1 h. I–M Analysis of expression levels of p-Akt/Akt, p-Gsk3β/Gsk3β, Bax/Bcl-2, and cle-Cas3/pro-Cas3 by western blotting pre-treated with SC79 for 30 min, followed by H2O2 treatment for 1 h. The data are represented by the mean ± SEM of three separate samples. (*p")
![Phospho-PI3K p85 (Tyr458)[Tyr467]/p55 (Tyr199) Antibody - Fig.](http://img.affbiotech.cn/uploads/202402/ee972c524ebd0eb2a5e99e4338d10ad8.png "Fig. 4. The PI3K/AKT/GSK3β pathway is activated by overexpression of FSP1. Each group has representative images of Western blotting of PI3K, pPI3K, AKT, p-AKT, GSK3β, and p-GSK3β. Overexpression of FSP1 increased p-PI3K, p-AKT, and p-GSK3β levels compared to the OGD/R group and OGD/R + OE-NC group")
![Phospho-PI3K p85 (Tyr458)[Tyr467]/p55 (Tyr199) Antibody - Fig.](http://img.affbiotech.cn/uploads/202403/3ea6e892b2cf7060a79cbb9d7088efe1.png "Fig. 4 CTSS deficiency ameliorated stress-related anabolic and catabolic molecular alterations. a–e: Representative immunoblotting images and quantitative data for CTSS, IGF-1, IRS-2, p-PI3K, p-Akt, p-mTOR, p-FoxO1α, MuRF-1, MAFbx1, PGC-1α, PPAR-γ, C-caspase-3, and Bcl-2 in GAS muscles at Day 14 after stress (n = 3). Data are mean ± SEM, and p-values were determined by a one-way ANOVA followed by Bonferroni post hoc tests (b–e). CW: CTSS+/+ control mice, CK: CTSS−/− control mice, SW: 14-day-stressed CTSS+/+ mice, SK: 14-day-stressed CTSS−/− mice. *p")
![Phospho-PI3K p85 (Tyr458)[Tyr467]/p55 (Tyr199) Antibody - Fig.](http://img.affbiotech.cn/uploads/202404/946ac9e7e88b8604e8e7b3c2174b457e.png "Fig. 4. Liensinine blocks autophagic flux through the PI3K/AKT/mTOR pathway in Beas-2B cells with LPS treatment. Western blot detected the levels of p-PI3K, PI3K, p-AKT, AKT, p-mTOR, mTOR (A-C). The values presented are mean ± SEM, *P")
![Phospho-PI3K p85 (Tyr458)[Tyr467]/p55 (Tyr199) Antibody - Fig.](http://img.affbiotech.cn/uploads/202404/ba1c272b0886ff5c0971db4c9105cc3c.png "Fig. 3 Palmatine regulates the PI3K/AKT signaling pathway in CMT-U27 cells. A-D CMT-U27 cells grown in 6-well plates and then cultured in fresh media containing various concentrations of palmatine for 18 h at 37ºC. After treatment, the cells were harvested for western blotting to quantify the expression of p-PI3K (A), PTEN, p-PTEN (B), AKT, p-AKT (C), mTOR, p-mTOR (D), and β-actin. E–H CMT-U27 cells grown in 24-well plates and then cultured in fresh media containing various concentrations of palmatine for 18 h at 37ºC. After treatment, immunocytochemistry was performed to quantify the expression of p-PI3K (E) and p-PTEN (G). Scale bar, 50 µm. Values are mean ± SD.")
![Phospho-PI3K p85 (Tyr458)[Tyr467]/p55 (Tyr199) Antibody - Fig.](http://img.affbiotech.cn/uploads/202404/101d01c1cde821169faeaa25538d2a2f.png "Fig. 3 Palmatine regulates the PI3K/AKT signaling pathway in CMT-U27 cells. A-D CMT-U27 cells grown in 6-well plates and then cultured in fresh media containing various concentrations of palmatine for 18 h at 37ºC. After treatment, the cells were harvested for western blotting to quantify the expression of p-PI3K (A), PTEN, p-PTEN (B), AKT, p-AKT (C), mTOR, p-mTOR (D), and β-actin. E–H CMT-U27 cells grown in 24-well plates and then cultured in fresh media containing various concentrations of palmatine for 18 h at 37ºC. After treatment, immunocytochemistry was performed to quantify the expression of p-PI3K (E) and p-PTEN (G). Scale bar, 50 µm. Values are mean ± SD.")
![Phospho-PI3K p85 (Tyr458)[Tyr467]/p55 (Tyr199) Antibody - Fig.](http://img.affbiotech.cn/uploads/202404/35debeeace001149446f4938255bab7a.png "Fig. 1 Dox induces the apoptosis of cardiac cells. Cells were treated with Dox at concentrations of 0.5, 1, and 1.5 μM for 24 h. The expression of PI3K/Akt, Bcl-2, and caspase-3 were evaluated by western blot analysis. β-actin was used as a loading control. Values shown are means ± SD. Quantification of the results is shown (n = 3); *p < 0.05, **p < 0.01, ***p < 0.001 versus control cells.")
![Phospho-PI3K p85 (Tyr458)[Tyr467]/p55 (Tyr199) Antibody - Figure 8 PF downregulated the protein expression levels of p-AKT1/AKT1, Bcl-2, EGFR, p-mTOR/mTOR, and p-PI3K/PI3K in the colonic mucosa from the dextran sodium sulfate-induced mice.](http://img.affbiotech.cn/uploads/202405/23ce2606659c665c51cfbef9705d0073.png "Figure 8 PF downregulated the protein expression levels of p-AKT1/AKT1, Bcl-2, EGFR, p-mTOR/mTOR, and p-PI3K/PI3K in the colonic mucosa from the dextran sodium sulfate-induced mice. Data are presented as the mean ± SD. *P")
![Phospho-PI3K p85 (Tyr458)[Tyr467]/p55 (Tyr199) Antibody - Fig.](http://img.affbiotech.cn/uploads/202406/1139529ad4ead327cc196667e4f73239.png "Fig. 8 Flavokawain C inhibited the expression of p-PI3K, p-AKT and p-FAK, and reduces the front distribution of FAK in liver cancer cells. A Western blot assay determined the abundance of p-PI3K, PI3K, p-AKT and AKT in Huh-7 and Hep3B cells. Cells were treated with the indicated concentration of flavokavain C or 0.01% DMSO (Control) for 48 h before cell lysis. GAPDH was used as a positive control. B–E Quantitative analysis of A. F The same as A, except p-FAK and FAK protein were detected. G, H Quantitative analysis of F. I Representative images illustrating the reduction of FAK (green) distribution at the leading edge of cells following flavokawain C treatment, shown by immunofluorescence (IF) assay. Actin cytoskeleton was stained with phalloidin (red), and nuclei were stained with DAPI (blue). The results were obtained from three independent experiments and the values were presented as mean ± SD. The statistical analysis was conducted using a two-tailed, unpaired Student's t-test (ns means no significance with p > 0.05, *p")
![Phospho-PI3K p85 (Tyr458)[Tyr467]/p55 (Tyr199) Antibody - Figure 7.](http://img.affbiotech.cn/uploads/202406/e60e97a871ba8804e1720b6b0da6cb63.png "Figure 7. NMU regulates ILC2 activation via PI3K/NFAT and MEK/NFAT signals. ILC2s were sorted from the lungs of mice on day 3 after RSV infection, and co-cultured with NMU in vitro in the presence or absence of signal inhibitors. A-C Expressions of IL-5 and IL-13 by Real-time PCR in the presence of MEK inhibitor U0126-EtOH (A), PI3K inhibitor LY294002 (B), and NFAT inhibitor 11R-VIVIT (C). D-E Concentrations of IL-5 and IL-13 in the culture supernatants of pulmonary ILC2s were determined by ELISA in the presence of MEK inhibitor U0126-EtOH (D), PI3K inhibitor LY294002 (E), and NFAT inhibitor 11R-VIVIT (F). G-H The expression of signal proteins in the isolated ILC2s were determined by Western blot under the conditions of the presence or absence of U0126-EtOH (G) or LY294002 (H). Data are representative of at least two individual experiments, error bars represent SEM;")
![Phospho-PI3K p85 (Tyr458)[Tyr467]/p55 (Tyr199) Antibody - Figure 5 Protein expression/phosphorylation of markers of MAPK and PI3K-AKT signaling pathways.](http://img.affbiotech.cn/uploads/202406/d0d47a9b1ddbf3c4a816ad4a948b1537.png "Figure 5 Protein expression/phosphorylation of markers of MAPK and PI3K-AKT signaling pathways. p-p38 MAPK (A), p-JNK (B), p-ERK (C), p-P13K (D), p-AKT (E), p-AMPK (F), PGC-1α (G), and mTOR (H) were detected with a high-content imaging analysis system. (A): representative images, bar size: 50 μm. The assays were performed in triplicate with three technical replicates.")
![Phospho-PI3K p85 (Tyr458)[Tyr467]/p55 (Tyr199) Antibody - Fig.](http://img.affbiotech.cn/uploads/202406/506bb026d221b19a4de139823b94f475.png "Fig. 9 ACS activated PI3K/AKT pathway. WB analysis of PI3K, p-PI3K (A, B), AKT, p-AKT (C, D), GSK3β, p-GSK3β (E, F). Full-length gels before cropping are noted in fig. S1. Data were presented as mean ± SD.")
![Phospho-PI3K p85 (Tyr458)[Tyr467]/p55 (Tyr199) Antibody - Fig.](http://img.affbiotech.cn/uploads/202406/9d5f9f06d09a8f7d05ad5d676d281da1.png "Fig. 9. EPA targets PGAM2 and activates the PI3K/AKT pathway. A. Heatmap of differentially expressed genes as determined via RNA-seq. B. KEGG pathway analysis of differentially expressed genes. C. The MuSC protein levels of the components of the PI3K/AKT pathway after EPA treatment and PGAM2 interference were measured by western blotting (n = 3). D. ELISA for the effect of EPA after PGAM2 knockdown (n = 3). E. Effect of EPA on the protein levels of components in the PI3K/AKT pathway after knockdown as analyzed by western blotting (n = 2). F–G. Effects of EPA and a PI3K/AKT pathway inhibitor (GDC-0941) on the protein levels of components of the PI3K/AKT pathway in MuSCs (F) and C2C12 cells (G) as determined by western blotting (n = 3). H. Immunofluorescence staining of MyHC to evaluate the differentiation of MuSCs and C2C12 cells. Results are mean ± SEM. ANOVA post-hoc analysis was performed using Fisher's least significant difference test.")
![Phospho-PI3K p85 (Tyr458)[Tyr467]/p55 (Tyr199) Antibody - Figure 6 Western blotting results demonstrate that ERB-041 and genistein synergistically regulate the expression of the PI3K/AKT pathway.](http://img.affbiotech.cn/uploads/202406/fb8915f8783a40ad92863503444d25de.png "Figure 6 Western blotting results demonstrate that ERB-041 and genistein synergistically regulate the expression of the PI3K/AKT pathway. (A–D) Western blot images and quantification of p-PI3K (A), PTEN, p-PTEN (B), AKT, p-AKT (C), mTOR, and p-mTOR (D) expression in CMT-U27 following ERB-041 and genistein treatment; (E–H) Western blot images and quantification of the expression of PI3K/AKT-pathway-related proteins in CF41.Mg of ERB-041 and genistein at the indicated concentrations. PI3K, phosphoinositide 3-kinases; PTEN, phosphatase and tensin homolog; mTOR, mechanistic target of rapamycin. Values are mean ± SD. * p < 0.05; ** p < 0.01; *** p < 0.001 versus untreated cells by one-way ANOVA followed by Bonferroni post hoc test.")
![Phospho-PI3K p85 (Tyr458)[Tyr467]/p55 (Tyr199) Antibody - Fig.](http://img.affbiotech.cn/uploads/202406/c65e18d09b54905813085e5857d230da.png "Fig. 6. Impact of DBL on Pathways, Functions, and Protein Expression in PTC Cells. (A–B) KEGG enrichment and GO enrichment analysis. (C) WB analysis of p-PI3K and p-AKT in PTC cells compared to Nthy-ori3-1 cells. (D–E) Statistical analysis, *p < 0.05, **p < 0.01, ***p < 0.001 vs. Nthy-ori3-1 group; (F–G) p-PI3K and p-AKT protein expression in each group in PTC cells. (H–I) Statistical analysis")
![Phospho-PI3K p85 (Tyr458)[Tyr467]/p55 (Tyr199) Antibody - Fig.](http://img.affbiotech.cn/uploads/202406/7833999d9a4a2bde7787d04bf844eb3b.png "Fig. 6 VREs activated the PI3K/AKT/mTOR pathway in cells")
![Phospho-PI3K p85 (Tyr458)[Tyr467]/p55 (Tyr199) Antibody - Figure 10 Validation of the predicted target proteins with Western blotting.](http://img.affbiotech.cn/uploads/202406/304e00359f120005973de9a1442d07fe.png "Figure 10 Validation of the predicted target proteins with Western blotting. (A) Representative Western blots showing the detection of p-PI3K, PI3K, p-Akt, Akt, ace-NF-κB and NF-κB. (B-D) The phosphorylation levels of AKT, PI3K and the acetylation of NF-κB decreased after treatment of ACT. Data are expressed as mean ± SD, n = 5. *P")
![Phospho-PI3K p85 (Tyr458)[Tyr467]/p55 (Tyr199) Antibody - Figure 4 CoQ10 inactivates the PI3K/AKT/mTOR and MAPK signaling pathways in RANKL-treated RAW264.](http://img.affbiotech.cn/uploads/202407/7bbc1b191c9452964f5de89352acb5de.png "Figure 4 CoQ10 inactivates the PI3K/AKT/mTOR and MAPK signaling pathways in RANKL-treated RAW264.7 cells. After RAW264.7 cells were treated with 10-3 M CoQ10 with or without 10-4 M H2O2 in the presence of 50 ng/mL RANKL, PI3K/AKT/mTOR, and MAPK signaling pathway-related proteins were tested. A, The levels of p-PI3K/t-PI3K; B, p-AKT/t-AKT; C, p-mTOR/t-mTOR; D, p-ERK/t-ERK; and E, p-p38/t-p38. CoQ10: Coenzyme Q10; PI3K: phosphatidylinositol 3 kinase; MAPK: mitogen-activated protein kinase; RANKL: receptor activator of NF‐κB ligand. The data are reported as means±SD. *P")
![Phospho-PI3K p85 (Tyr458)[Tyr467]/p55 (Tyr199) Antibody - Fig.](http://img.affbiotech.cn/uploads/202407/815aaaa8291b2c02ecaf9a42c588b1cd.png "Fig. 7 Inhibition of the PI3K/Akt/mTOR pathway by Sirt3 mediates the restoration of autophagic flux impaired by ODG/R. (A–D) Representative Western blot (A) and analysis of the p-PI3K/t-PI3K (B), p-Akt/t-Akt (C) and p-mTOR/t-mTOR (D) ratios in cardiomyocytes. H9C2 cells were transfected with Sirt3-siRNA or scramble siRNA (SC-siRNA) 48 h before the establishment of the OGD/R model, followed by normothermia (NT) or TH treatment (n = 4 per group, one-way ANOVA with Bonferroni’s post hoc test). The data are presented as the mean ± SD. **P < 0.01, ***P < 0.001 vs. the SC-siRNA group; #P < 0.05, ##P < 0.01, ###P < 0.001 vs. the OGD/R + SC-siRNA group; †P < 0.05 vs. the OGD/R + Sirt3-siRNA group; §P < 0.05, §§P < 0.01, §§§P < 0.001 vs. the OGD/R + TH + SC-siRNA group. (E–J) Representative Western blot (E) and analysis of the p-PI3K/t-PI3K (F), p-Akt/t-Akt (G), and p-mTOR/t-mTOR (H) ratios and LC3-II (I) and p62 (J) levels in cardiomyocytes. Forty-eight hours before OGD/R, H9C2 cells were transfected with Sirt3-siRNA or SC-siRNA. After preconditioning with LY294002 (20 μmol/L) for 2 h, the cells were subjected to OGD/R followed by NT or TH treatment (n = 4 per group, one-way ANOVA with Bonferroni’s post hoc test). (K) Representative images of fluorescence staining of autophagosomes and autolysosomes with DAPRed and DALGreen under confocal microscopy. Yellow fluorescence resulting from merged from red and green fluorescence labels autolysosomes, and red fluorescence indicates autophagosomes (scale bar: 10 μm). (L) Analysis of the autolysosome/autophagosome ratio calculated as the ratio of the average number of fluorescent yellow puncta to the average number of red puncta per cell (n = 6 per group, one-way ANOVA with Bonferroni’s post hoc test). The data are presented as the mean ± SD. *P < 0.05, **P < 0.01, ***P < 0.001 vs. the OGD/R + TH + SC-siRNA group; ###P < 0.001 vs. the OGD/R + TH + SC-siRNA+LY294002 group; §§P < 0.01, §§§P < 0.001 vs. the OGD/R + TH + Sirt3-siRNA group. OGD/R, oxygen-glucose deprivation/reoxygenation; TH, therapeutic hypothermia; LC3, microtubule-associated protein light chain 3.")
![Phospho-PI3K p85 (Tyr458)[Tyr467]/p55 (Tyr199) Antibody - Fig.](http://img.affbiotech.cn/uploads/202408/c5ab1b91afc551fd3a962a0176ea5115.png "Fig. 6 Circ_003686/miR-142-5p/IGF1 axis regulates osteogenic differentiation of BMSCs. (A) Alizarin red staining was used to analyze osteogenesis-induced differentiation ability. The mRNA expressions of alkaline phosphatase (ALP) (B), osteopontin (OPN) (C) and osteocalcin (OC) (D) were detected by RT-PCR, and ACTIN was applied as the normalization standard. (E) The protein expressions of AKT-PI3K signaling pathway were detected by WB, and the densitometry of p-AKT/AKT (F), p-mTOR/mTOR (G) and p-PI3K/PI3K (H) was analyzed. * P < 0.05, ** P < 0.01 and *** P < 0.001. (For interpretation of the references to color in this figure legend, the reader is referred to the web version of this article.)")
![Phospho-PI3K p85 (Tyr458)[Tyr467]/p55 (Tyr199) Antibody - Fig.](http://img.affbiotech.cn/uploads/202408/b9e236c33bacee0447e5103099058de8.png "Fig. 5 LY294002 attenuates the responsiveness of 10− 6 M insulin to the IIS/PI3K/AKT/mTOR pathway axis in human DPSCs. A LY294002 attenuated the inhibiting effect of 10− 6 M insulin on the protein expressions of INSR, IGF1R, and IRS1 in DPSCs at day 7. B and C LY294002 attenuated the responsiveness of 10− 6 M insulin to the PI3K/AKT pathway in DPSCs at day 7. D LY294002 attenuated the promoting effect of 10− 6 M insulin on the protein expression of mTOR in DPSCs at day 7. Representative western blotting (left) and quantification analysis (right). Data are expressed as the mean ± SD of n = 3. Full-length blots/gels are presented in Supplementary Figs. 3–6. *P")
![Phospho-PI3K p85 (Tyr458)[Tyr467]/p55 (Tyr199) Antibody - Fig.](http://img.affbiotech.cn/uploads/202408/eb251e60eecd97f66577beca61c23011.png "Fig. 3 β-elemene suppressed the proliferation and promoted the apoptosis of PHEGFs. (A) Endoscopic view after ESD and PHEGFs culture at different stages. (B) The primary cells were identified as fibroblasts by immunocytochemistry. (C) Flow cytometry detection of PHEGFs apoptosis rate after β-elemene intervention (n = 3). (D) CCK-8 to assess the proliferation of PHEGFs after β-elemene intervention (n = 3). (E) Flod change of FAP, p-PTEN, p-PI3K, and p-AKT (n = 3).*P < 0.05 versus the control group.")
![Phospho-PI3K p85 (Tyr458)[Tyr467]/p55 (Tyr199) Antibody - Fig.](http://img.affbiotech.cn/uploads/202409/67262782ae0ecfbb2f2bbc077a6b7cb5.png "Fig. 5. Experimental verification. (A) LINC01234 binding to hsa-miR-30c-2-3p verified by dual-luciferase reporter assay. In this assay, 2 × 10⁵ BT-20 cells were used in a 24-well plate. (B) CCT4 was a direct target of hsa-miR-30c-2-3p verified by dual-luciferase reporter assay. In this assay, 2 × 10⁵ BT-20 cells were used in a 24-well plate. (C) CCK8 assay was performed with 5 × 10³ BT-20 cells in a 96-well plate. (D) Transwell invasion and migration assays were performed with 5 × 10³ BT-20 cells in a 96-well plate. (E) Statistical graph of Transwell invasion and migration assays. (F) The activity of the mTOR signaling pathway was decreased following LINC01234-siRNA interference. In the Western blot assay, BT-20 cells were used to extract total protein.")
![Phospho-PI3K p85 (Tyr458)[Tyr467]/p55 (Tyr199) Antibody - Fig.](http://img.affbiotech.cn/uploads/202409/6b80aa94a4a0407683b7682004796983.png "Fig. 5 RPLP2 affects HIF-1α by regulating the PI3K/AKT pathway. A KEGG pathway analysis of differentially expressed genes when RPLP2 was knocked down in Hep3B and Huh7 cells. B Western blot analysis showed a decrease in the protein levels of p-PI3K and p-AKT after RPLP2 knockdown and the quantitative analysis (n = 3, mean ± SD) is shown in (C). D After treatment of Hep3B cells with the AKT activator SC79 (10 µM) for 24 h, Western blotting was used to detect the expression of HIF-1α and p-AKT, and quantitative analysis (n = 3, mean ± SD) was performed in (E). After treatment with SC79, the expression of HIF-1α and p-AKT was rescued. F Western blotting was used to determine the effect of SC79 on HIF-1α levels in the cytoplasm and nucleus, and the quantitative analysis (n = 3, mean ± SD) was performed in (G). SC79 restored HIF-1α levels in the cytoplasm and nucleus. H Immunostaining of Hep3B cells with antibodies against HIF-1α (red). Knocking down RPLP2 led to a decrease in the nuclear expression level of HIF-1α, which was abrogated by SC79. Scale bar, 25 μm. *P")
![Phospho-PI3K p85 (Tyr458)[Tyr467]/p55 (Tyr199) Antibody - Fig.](http://img.affbiotech.cn/uploads/202409/902942ad7588e818eff7901503c3b004.png "Fig. 9 Effect of palmar ginseng on protein expression of PI3k/Akt/mTOR pathway in rats with diabetic cognitive impairment. Palmer ginseng activates the PI3K/Akt/mTOR pathway to improve cognitive impairment in diabetes. (Compared with the blank group,#P<0.05,##P<0.01.compared with the model group,*P<0.05,**P<0.01).")
![Phospho-PI3K p85 (Tyr458)[Tyr467]/p55 (Tyr199) Antibody - Figure 6 (A)、(C)、(E) Western blotting to detect the expression of PI3K, p-PI3K, Akt, p-Akt, WNK1 and p-WNK1 protein.](http://img.affbiotech.cn/uploads/202409/e10a3422eee2e7717165b9a9936a80e8.png "Figure 6 (A)、(C)、(E) Western blotting to detect the expression of PI3K, p-PI3K, Akt, p-Akt, WNK1 and p-WNK1 protein. (B)、(D)、(F) The optical density of protein bands detected by Western blotting was statistically quantified by IPP 6.0 software; (B) Protein expression of PI3K and p-PI3K; (D) Protein expression of Akt and p-Akt; (F) Protein expression of WNK1 and p-WNK1. N: Normal group, BCP: Bone cancer pain group, Akt-i: Akt inhibitor group. n = 3; *P")
![Phospho-PI3K p85 (Tyr458)[Tyr467]/p55 (Tyr199) Antibody - Figure 2 CAP alleviates inflammation in LPS-stimulated BEAS-2B cells.](http://img.affbiotech.cn/uploads/202409/2d5a5a2245d99a1c28afe3aa39ba44c4.png "Figure 2 CAP alleviates inflammation in LPS-stimulated BEAS-2B cells. (a) ELISA kits were used to measure levels of TNF-α, IL-6, and IL-1β. (b) Cell viability was assessed using the CCK-8 assay. (c) Volcano plot. (d) GO enrichment analysis of CAP pretreated BEAS-2B cells after LPS stimulation (top 10 inflammation-related pathways). (e) KEGG enrichment analysis of CAP pretreated BEAS-2B cells after LPS stimulation (top 10 inflammation-related pathways). (f) The expression levels of critical proteins involved in the PI3K/AKT and NF-κB signaling pathways were measured by WB. (g) Statistical analyses of p-PI3K, p-AKT, and p-p65 in BEAS-2B cells. (n=3~5) *P < 0.05, **P < 0.01, ***P < 0.001, ****P < 0.0001.")
![Phospho-PI3K p85 (Tyr458)[Tyr467]/p55 (Tyr199) Antibody - Figure 4 MA treatment modulated the activation of the NF-κB and PI3K/AKT signaling pathways in TNFα-stimulated NPCs (A) Western blot analysis of the NF-κB pathway in TNFα-treated NPCs with or without MA.](http://img.affbiotech.cn/uploads/202409/80c2f4f85ec7cc39bb87d7900e54ef5a.png "Figure 4 MA treatment modulated the activation of the NF-κB and PI3K/AKT signaling pathways in TNFα-stimulated NPCs (A) Western blot analysis of the NF-κB pathway in TNFα-treated NPCs with or without MA. (B) Immunofluorescence was utilized to detect p65. Scale bar: 20 μm. (C) Western blot analysis of the PI3K pathway in TNFα-treated NPCs treated with or without MA. (D) Ribbon model depicting the structure of PI3K. (E,F) The space-filling model illustrates the interaction between MA and PI3K, which results in a reaction with an interaction energy of –10.35 kcal mol−1.")
![Phospho-PI3K p85 (Tyr458)[Tyr467]/p55 (Tyr199) Antibody - Fig.](http://img.affbiotech.cn/uploads/202409/4bfd7284f657318d71ccef2a27e10788.png "Fig. 7 Treatment with JDF (3 mg/mL) inhibited the CSF-1/PI3K/AKT signaling pathway and promoted apoptosis of M2 macrophages. A. Western blotting was used to determine the activity of PI3K/AKT pathway. B–C. The apoptosis of M2 macrophages was measured by flow cytometry. D. Western blotting was used to determine the expression of cleaved caspase-3. The original blots for the protein immunoblotting were provided in Supplementary Fig. S6. **P < 0.01 vs. Scramble; #P < 0.05 and ##P < 0.01 vs. shCSF-1; ^ P < 0.05 vs. JDF; $ P < 0.05 and $$ P < 0.01 vs. JDF-shCSF-1.")
![Phospho-PI3K p85 (Tyr458)[Tyr467]/p55 (Tyr199) Antibody - Fig.](http://img.affbiotech.cn/uploads/202410/4d34d15dc9fda70bf3f6e71e208d9887.png "Fig. 5. A Apoptosis was examined by flow cytometry. B Apoptosis was determined by mitochondrial membrane potential assay, scale bar: 50 μm. C qPCR was used to detect mRNA expression of PI3K, AKT, mTOR, BCL-2, BAX, caspase-3, and caspase-6. D, E The protein expression levels of p-PI3K, PI3K, p-AKT, AKT, BAX, BCL-2, caspase-3, and cleaved-caspase-3 were examined using a western blot. The full-length blots are presented in Supplementary Figure. ** P")
![Phospho-PI3K p85 (Tyr458)[Tyr467]/p55 (Tyr199) Antibody - Figure 4.](http://img.affbiotech.cn/uploads/202411/4c548b2492facad7d29a792f27bcdeea.png "Figure 4. PUE attenuates COM crystal-induced cell apoptosis.(A-F).Western blot and quantitative analysis of p-PI3K, PI3K, p-AKT, AKT, Cleaved-caspase3, caspase3, Bax and Bcl2. (G) HK-2 cells were stained with TUNEL for detection of apoptosis. The staining shows green fluorescence when the cells are in the process of dying. (H) The effect of PUE on COM-induced apoptosis in HK-2 cells was analyzed by flow cytometry. Data are shown as the mean ± S.E.M. ****p")
![Phospho-PI3K p85 (Tyr458)[Tyr467]/p55 (Tyr199) Antibody - Figure 3.](http://img.affbiotech.cn/uploads/202412/cf81785301a28a19bba0eb160f011e23.png "Figure 3. Effects of rPVL on the regulation of RhoA/ROCK/LIMK/Cofilin and PI3K/AKT/GSK-3β signaling pathways and phosphorylation of cofilin and tau hyperphosphorylation in the rPVL-treated BMECs. Representative immunoblot bands for RhoA, p-ROCK2(Tyr722), ROCK2, p-LIMK1/2(Thr508/Thr505), p-cofilin (Ser3), and cofilin (A); p-PI3K (Tyr458/Tyr199), PI3K, p-AKT(Ser473), AKT, GSK-3β(Ser9), GSK-3β, p-tau (Ser396), and tau (B); GAPDH was used as a control. rPVL was used at a 100 ng/mL concentration. Data are expressed as mean ± standard deviation of three independent experiments. * 0.01 < p < 0.05, ** p < 0.01 (one-way ANOVA with Dunnett’s multiple comparison tests), ns: not significant.")
![Phospho-PI3K p85 (Tyr458)[Tyr467]/p55 (Tyr199) Antibody - Figure 8.](http://img.affbiotech.cn/uploads/202412/54bb991e5761310cab7d24c2ff120816.png "Figure 8. HGWD alleviated apoptosis after cerebral I/R. (A) TUNEL staining images of five groups. (Scale bar = 50 μm, 400×). (B) HGWD reduced cell apoptosis through PI3K/AKT signalling pathway. Western blotting was utilized to examine the levels of Bcl-2, Bax, caspase-3, cleaved caspase-3, AKT1, p-AKT1, PI3K, and p-PI3K. (C) Percentages of TUNEL positive cells were utilized to evaluate the differences in the five groups. Integrated density data were quantified (D-J). the results (D-H), respectively, showed the levels of Bax, Bcl-2, the ratio of Bcl-2/Bax, caspase-3, and cleaved caspase-3 in the brains of rats for five groups, with β-actin as the internal control. The results of I and J, respectively, showed the ratios of p-AKT1/AKT1 and p-PI3K/PI3K in the brains of rats for five groups. All data were shown as mean ± SD. (n = 3, *p")
![Phospho-PI3K p85 (Tyr458)[Tyr467]/p55 (Tyr199) Antibody - Fig.](http://img.affbiotech.cn/uploads/202412/9be5ac587eca0628e49ecf6498ea03d0.png "Fig. 7. Celastrol treatment inhibited the PI3K-AKT-GSK-3β pathway in the hippocampus of diabetic rats. (A) Representative images of p-PI3K and PI3K levels by Western-blot; (B) Quantitative evaluation of p-PI3K; (C) Representative images of p-AKT and AKT levels by Western-blot; (D) Quantitative evaluation of p-AKT; (E) Representative images of p-GSK-3β and GSK-3β levels by Western-blot; (F) Quantitative evaluation of p-GSK-3β. All data are presented as mean ± SEM (n = 3). Statistical significance was analyzed by one-way ANOVA followed by post hoc Tukey’s test. *P < 0.05, **P < 0.001 vs. Control; #P < 0.05, ##P < 0.01 vs. DM+celastrol.")
![Phospho-PI3K p85 (Tyr458)[Tyr467]/p55 (Tyr199) Antibody - Figure 6.](http://img.affbiotech.cn/uploads/202510/4a45f730faf6757380dd5f8850558e28.png "Figure 6. Effects of normal, knockdown, and overexpression of Octamer transcription factor 4 on PI3K/AKT/mTOR pathway protein expression in BxPC3 cells. aP < 0.05. OCT4: Octamer transcription factor 4.")
![Phospho-PI3K p85 (Tyr458)[Tyr467]/p55 (Tyr199) Antibody - Figure 6.](http://img.affbiotech.cn/uploads/202510/902b47ba224b7495bf1ffd6b775a4f10.png "Figure 6. The effect of PSE on PI3K/AKT1 pathway protein in intestinal tissue. The experimental groups were divided into four groups: (i) CON (drinking water), (ii) PBS (PBS), (iii) LPS (3.5 mg/kg BW), (iv) PSE (3.5 mg/kg and PSE 100 mg/kg/d) n = 3. Representative Western blot images (A) and quantification of AKT1 (B), p-AKT1 (C), p-AKT1/AKT1 (D), PI3K (E), p-PI3K (F), p-PI3K/PI3K (G) protein expression. PSE inhibits PI3K and AKT1 phosphorylation. Data are expressed as mean ± SEM. ## p < 0.01 vs. control group; * p < 0.05, ** p < 0.01 vs. LPS control group.")
![Phospho-PI3K p85 (Tyr458)[Tyr467]/p55 (Tyr199) Antibody - Fig.](http://img.affbiotech.cn/uploads/202511/3787ab7d543d406a4cae35801e622717.png "Fig. 4 MiR-103-3p activates the PI3K/Akt/mTOR pathway by targeting CPEB3. (A) Venn diagram showing possible targets of miR-103-3p predicted by online tools. (B) RNA pulldown assay and RT-qPCR results showing enrichment of ZHX1, AGFG1, ARMC1, RNF38, ZNRF2, SUN2, FAM117B, FERMT2, and CPEB3 bound to miR-103-3p probe in chondrocytes. (C) qPCR of CPEB3 level in mouse chondrocytes stimulated by IL-1β. (D) RT-qPCR of CPEB3 expression in chondrocytes stimulated by IL-1β or/and transfected with miR-103-3p inhibitor. (E) Binding sites where miR-103-3p interacts with CPEB3. (F) Luciferase activity of CPEB3 3’UTR-Wt/Mut reporters in chondrocytes following co-transfection with miR-103-3p mimic. (G-K) Western blotting of CPEB3, PI3K, Akt, and mTOR protein levels in IL-1β-stimulated chondrocytes transfected with miR-103-3p inhibitor or/and siCPEB3. N = 3. ***p")
![Phospho-PI3K p85 (Tyr458)[Tyr467]/p55 (Tyr199) Antibody - Fig.](http://img.affbiotech.cn/uploads/202512/6dfe4ec8ce3108b7e9c03401f2cba040.png "Fig. 7. APOE induces M2 macrophage polarization by affecting IL-10 and TGF-β1 expression through regulation of the PI3K/AKT/NF-κB pathway. a. Correlations of APOE expression with IL-10 and TGF-β1. b. Correlations of APOE expression with PI3K/AKT/NF-κB pathway protein. c. Effect of APOE knockdown on IL-10 and TGF-β1 protein expression in K1 cells. d. Levels of proinflammatory factors INF-γ and IL-8 in K1 cell supernatants measured using ELISA after silencing APOE. e. Influence of APOE knockdown on the levels of PI3K/AKT/NF-κB pathway protein expression in K1 cells. ***p < 0.001, **p < 0.01, *p < 0.05.")
![Phospho-PI3K p85 (Tyr458)[Tyr467]/p55 (Tyr199) Antibody - Figure 4 Molecular docking and protein regulation of Ba/F3-EGFR C797S cells by 5d.](http://img.affbiotech.cn/uploads/202512/e743f2729d2c49a82d97339f56b88c44.png "Figure 4 Molecular docking and protein regulation of Ba/F3-EGFR C797S cells by 5d. (A) Docking structures of 5d or Brigatinib with EGFR L858R/T790M/C797S; Compound 5d for 12 h on EGFR (B) and m-TOR (C) signalling pathways. Data are represented as mean ± SD.")
![Phospho-PI3K p85 (Tyr458)[Tyr467]/p55 (Tyr199) Antibody - Figure 10.](http://img.affbiotech.cn/uploads/202512/c7f1a10b37a81d30ee2a70c086f31c04.png "Figure 10. The downstream molecular mechanisms of IQGAP3 in U251 cells. (A) The mRNA expression levels of IQGAP3 PLK1, PI3K, AKT in shNC and shIQGAP3 groups of U251 cells. (B) The relative protein expression levels of IQGAP3 PLK1, PI3K, p-PI3K, AKT and p-AKT in shNC and shIQGAP3 groups of U251 cells.")
![Phospho-PI3K p85 (Tyr458)[Tyr467]/p55 (Tyr199) Antibody - Fig.](http://img.affbiotech.cn/uploads/202512/3536d3162935ca5a03c5978a5a6cf644.png "Fig. 6 RSBQD activated PI3K/AKT/Nrf2 signaling pathway in exercise fatigued mice (n = 10). A Hepatic GSH-Px activity. B Hepatic SOD activity. C Hepatic MDA content. D–F The relative mRNA levels of Sod1 (D), Nrf2 (E), and Ho-1 (F). G Representative images of Western blot. H–K Relative protein levels of KEAP1 (H), NRF2 (I), HO-1 (J), and NQO1 (K). (L, M) The ratio of p-PI3K/PI3K L and p-AKT/AKT M.")
![Phospho-PI3K p85 (Tyr458)[Tyr467]/p55 (Tyr199) Antibody - Fig.](http://img.affbiotech.cn/uploads/202601/3dd4c1ec3bb7f3377276ae75871c0948.png "Fig. 5 SLBP is a functional target of miR-654-3p and mediates PI3K/Akt activation in LUSC. A mRNA expression profiling of candidate targets post miR-654-3p overexpression. B Immunoblotting analysis of SLBP protein levels under miR-654-3p induction. C SLBP transcript quantification in clinical LUSC specimens. D In silico SLBP expression profile from starBase. E Co-expression correlation analyses: SLBP vs. miR-654-3p and SLBP vs. LINC00885. F SLBP basal expression in LUSC cell lines via RT-qPCR. G Predicted miR-654-3p binding site within SLBP 3’UTR. H Luciferase reporter assay: Wild-type vs. mutant SLBP constructs under combinatorial transfection conditions. I–J SLBP transcript and protein quantification following LINC00885 knockdown. K–L Immunoblotting evaluation of SLBP/PI3K/Akt pathway phospho-regulators. Data represent mean ± SD; n = 3 biological replicates")
![Phospho-PI3K p85 (Tyr458)[Tyr467]/p55 (Tyr199) Antibody - Fig.](http://img.affbiotech.cn/uploads/202601/5bbf5bc13a27565b9ee84a2b138c8e23.png "Fig. (5) DIOS induces apoptosis and autophagy via the PI3K/Akt/mTOR pathway. (A) A375 cells were exposed to 40 µM DIOS for 48 hours and then analyzed through transcriptome sequencing. The cluster analysis heat map of down-regulated differential genes. (B, C) GO and KEGG Pathway Enrichment Analysis. (D) GSEA showed that the PI3K/Akt Targets pathway was mainly enriched, and DIOS significantly inhibited this pathway. (E, F) The protein expression levels of p-PI3K, PI3K, p-Akt, Akt, p-mTOR and mTOR. * p < 0.05, ** p < 0.01, *** p < 0.001 vs. the control group.")
![Phospho-PI3K p85 (Tyr458)[Tyr467]/p55 (Tyr199) Antibody - Fig.](http://img.affbiotech.cn/uploads/202601/8140c53d1130a9c625671aa24a875a11.png "Fig. 3. Effects of salinomycin on the PI3K/AKT/mTOR signaling pathway in MCF-7 and MCF-7-TS cells.(A-B) Detection of PI3K/AKT/mTOR signaling pathway-related protein expression in MCF-7 cells was done using Western blot assay; (B) Western blot assay was used to measure the PI3K/AKT/mTOR signaling pathway-related protein expression in MCF-7-TS cells. Data are expressed as mean ± SD, n = 3. Compared with the control group, ▲P")
![Phospho-PI3K p85 (Tyr458)[Tyr467]/p55 (Tyr199) Antibody - Figure 6.](http://img.affbiotech.cn/uploads/202601/7a1679be1d97c1271eafb03da44d5811.png "Figure 6. Artemisinin derivatives interfere with the PI3K-AKT pathway to inhibit tumor cell PDGF-BB expression. Transcriptomic data analysis after DHA (8 μM) treatment of tumor cells for 48 hours (n = 3) (A-C). Volcano plot of differentially expressed genes (P < 0.05, Log10 FC < -1) (n = 3) (A). WikiPathway enrichment (n = 3) (B). KEGG pathway enrichment (n = 3) (C). Western blotting and quantification results of PI3K-AKT proteins after DHA and ARM treatment of tumor cells (n = 3) (D-G). Western blot of PI3K, p-PI3K, AKT, p-AKT, and PDGF-BB after DHA and ARM treatment of tumor cells (n = 3) (D). Quantification of p-PI3K/PI3K (n = 3) (E). Quantification of p-AKT/AKT (n = 3) (F). Quantification of PDGF-BB (n = 3) (G). Expression of p-AKT, AKT, and PDGF-BB after AKT inhibitor (AZD5363) treatment of tumor cells (n = 3) (H-J). Western blot of p-AKT, AKT, and PDGF-BB after AKT inhibitor (AZD5363) treatment of tumor cells (n = 3) (H). Quantification of p-AKT/AKT (n = 3) (I). Quantification of PDGF-BB (n = 3) (J). Expression of p-AKT, AKT, and PDGF-BB after AKT activator (SC79)/DHA and ARM treatment of tumor cells (n = 3) (K-M). Western blot of p-AKT, AKT, and PDGF-BB after AKT activator (SC79)/DHA and ARM treatment of tumor cells (n = 3) (K). Quantification of p-AKT/AKT (n = 3) (L). Quantification of PDGF-BB (n = 3) (M). p values were calculated using two-sided Student’s t-test (#P > 0.05, *P < 0.05, **P < 0.01, ***P < 0.001).")
![Phospho-PI3K p85 (Tyr458)[Tyr467]/p55 (Tyr199) Antibody - Figure 4.](http://img.affbiotech.cn/uploads/202601/5cb756930c0da3561a9792184d06d938.png "Figure 4. Effect of Jiawei Huangqi Guizhi decoction on the protein expression levels of PI3K/Akt/mTORC2 pathway-related targets in gastric mucosa of CAG rats. A: Western blot analysis of PI3K, p-PI3K, Akt, p-Akt and mTORC2 in different groups; B1-B5: quantitative analysis of protein levels of PI3K (B1), p-PI3K (B2), Akt (B3), p-Akt (B4) and mTORC2 (B5), normalized to GAPDH. NC group: normal rats without modeling or treatment (n = 10); MC group: rats with CAG induced by MNNG, without treatment (n = 10); AC group: CAG rats treated with folic acid (5 mg·kg-1·d-1, gavage, n = 10); HH group: CAG rats treated with high-dose Jiawei Huangqi Guizhi decoction (28 g/kg crude drug, gavage, n = 10); HM group: medium-dose group (14 g/kg crude drug, gavage, n = 10); HL group: low-dose group (7 g/kg crude drug, gavage, n = 10). All interventions were administered by gavage, once daily, 5 d per week for 6 weeks. Pi3K: phosphatidylinositol 3-kinase; p-Pi3K: phosphorylated phosphatidylinositol 3-kinase; Akt: protein kinase B; p-Akt: phosphorylated protein kinase B; mTORC2: mechanistic target of rapamycin complex 2s; GADPH: glyceraldehyde-3-phosphate dehydrogenase; CAG: chronic atrophic gastritis. Data are expressed as mean ± standard deviation (n = 10 per group). Statistical significance was determined by one-way analysis of variance. aP < 0.01; bP < 0.05, compared with the model group.")
![Phospho-PI3K p85 (Tyr458)[Tyr467]/p55 (Tyr199) Antibody - FIGURE 2 The effects of the 2-week chronic stress on the production of reactive oxygen species (ROS) and adipose remodeling.](http://img.affbiotech.cn/uploads/202601/09a594401b4feabb64835e0d64c86274.png "FIGURE 2 The effects of the 2-week chronic stress on the production of reactive oxygen species (ROS) and adipose remodeling. (A) Timeline of the 2-week chronic stress protocol and subcutaneous white adipose tissue (SWAT) sampling. (B, C) Photographs of SWAT and quantitative data showing the weight data of the body weight (BW) and SWAT in the two experimental groups (n = 10/group). (D, E) Representative immunoblot images and combined quantitative data showing the protein levels of caspase-8, p-AKT, and p-PI3K in both groups (n = 3/group). (F) ROS staining images and the combined quantitative data show the ROS production (n = 6/group). (G) H&E staining images and the combined quantitative data depicting the frequency of adipocyte area in the two experimental groups (n = 6/group). Scale bar: 75 μm. Data are mean ± SEM. NS: Not significant. Statistical significance was assessed by two-way ANOVA (B) or unpaired Student's t-test (C, E, F, right panels).")
![Phospho-PI3K p85 (Tyr458)[Tyr467]/p55 (Tyr199) Antibody - Fig.](http://img.affbiotech.cn/uploads/202601/aaa9fcdd5817a63c00c017d82fb60135.png "Fig. 4: Identification of biological pathways associated with the risk score. A GSVA of the risk score cohorts. Differentially expressed pathways were identified using GSVA through hallmark gene sets. B Scatterplot showing the top eight Pearson correlations between mRNAsi scores and the model genes in TCGA-HCC patients. C Gene set enrichment analysis (GSEA) with high and low MCM10 expression. The stemness-associated and drug-resistance-related sets enriched high MCM10 expression, including the E2F-targets, PI3K-AKT-MTOR signaling, are shown. D, E Western blots showing expression levels of total and phosphorylated AKT, PI3K, S6K1, and 4EBP1 proteins in MCM10‐overexpressed HepG2(D), MCM10‐knockout HepG2-SR(E), and control cells.")
![Phospho-PI3K p85 (Tyr458)[Tyr467]/p55 (Tyr199) Antibody - Fig.](http://img.affbiotech.cn/uploads/202601/06c6ca26f38d26abb4c857081739a3d2.png "Fig. 6 UCMSC-Exos restored vitality in senescent JBMMSCs by downregulating PI3K/AKT/mTOR pathway. (A-D) The protein levels of p-PI3K, p-AKT and p-mTOR were detected by western blotting. Full-length blots are presented in Supplementary Fig. S1. n = 3. (E-H) After being treated with 740 Y–P, the levels of p-PI3K, p-AKT and p-mTOR were detected by western blotting. Full-length blots are presented in Supplementary Fig. S1. n = 3. (I) The SA-β-gal staining for senescent JBMMSCs with UCMSC-Exos or/and 740 Y–P and quantification of β-galactosidase-positive cells out of total cells. Scale Bar: 100 μm. n = 6. (J-O) After being treated with 740 Y–P, the levels of P62, LC3II/LC3I, P53, P21 and P16 were detected by western blotting. Full-length blots are presented in Supplementary Fig. S1. n = 3.")
![Phospho-PI3K p85 (Tyr458)[Tyr467]/p55 (Tyr199) Antibody - Fig.](http://img.affbiotech.cn/uploads/202601/119ad2b489bd96071777131f24132123.png "Fig. 7. LAMC1 promotes high glucose-induced EMT in ARPE-19 cells through the PI3K/AKT pathway. A-B: Western blot analysis of p-PI3K and p-AKT levels in ARPE-19 cells. C: Western blot analysis of EMT-related proteins in ARPE-19 cells. D: Scratch assay to evaluate cell migration ability. E: Transwell assay to assess cell invasion capability. Experiments were repeated three times independently (n = 3). P-value were calculated using two-tailed Student’s t-test. Data were displayed as mean ± SD.")
![Phospho-PI3K p85 (Tyr458)[Tyr467]/p55 (Tyr199) Antibody - Figure 5: Attenuation of podocyte injury by inhibiting the PI3K/AKT/NF-κB signaling pathway.](http://img.affbiotech.cn/uploads/202601/79a614238c050403b08509d1c4cc6126.png "Figure 5: Attenuation of podocyte injury by inhibiting the PI3K/AKT/NF-κB signaling pathway. (A-D) PCR to detect the relative mRNA expression of Pi3k, Akt, Nf-κb, and Il-1β in renal tissues. (E-I) WB to detect the relative protein expression levels of P-PI3K, P-AKT, P-NF-κB, and IL-1β in renal tissues, and semi-quantitative analysis was performed using ImageJ software.")
![Phospho-PI3K p85 (Tyr458)[Tyr467]/p55 (Tyr199) Antibody - Fig.](http://img.affbiotech.cn/uploads/202601/d23ca651413708edeb64f78220d4c465.png "Fig. 7 In vivo effects of ATO in BALB/C nude mice. (A) Tumor response to ATO intervention in BALB/C nude mice xenografts. (B) Lack of significant cardiorenal toxicity post-ATO treatment in BALB/C nude mice. (C) Elevated expression of hsa-mir-573 in xenograft tumors following ATO treatment. (D) Decreased DYNAP expression in xenografts after ATO intervention. (E) Reduced P-AKT protein expression in AMC-HN-8 cells post-ATO treatment. (F) Decreased P-AKT and P-PI3K protein levels in BALB/C nude mice xenografts following ATO intervention. Statistical significance: p")
![Phospho-PI3K p85 (Tyr458)[Tyr467]/p55 (Tyr199) Antibody - FIGURE 8 Phillyrin inhibits the PI3K/AKT/mTOR signaling pathway.](http://img.affbiotech.cn/uploads/202601/09d79695d24a0019b8d723faf280f773.png "FIGURE 8 Phillyrin inhibits the PI3K/AKT/mTOR signaling pathway. (A, B) The western blot analysis revealed a downregulation in the expression of p-PI3K, p-AKT, and p-mTOR in HT29 and HCT116 cells following treatment with phillyrin. Values are expressed as means ± SD; n = 3. *p")
![Phospho-PI3K p85 (Tyr458)[Tyr467]/p55 (Tyr199) Antibody - Figure7 RCN1 regulates the PI3K-AKT signaling pathway by targeting KIF14 a Effects of RCN1 knockdown and overexpression on key proteins in KIF14, PI3K/AKT/mTOR pathway in C33A cells.](http://img.affbiotech.cn/uploads/202602/755ef82010b3d44dc5d450406079c90b.png "Figure7 RCN1 regulates the PI3K-AKT signaling pathway by targeting KIF14 a Effects of RCN1 knockdown and overexpression on key proteins in KIF14, PI3K/AKT/mTOR pathway in C33A cells. b Effects of RCN1 knockdown and overexpression on key proteins in KIF14, PI3K/AKT/mTOR pathway in Hela cells. The data are shown as mean ± SEM. n = 3. *p < 0.05, **p< 0.01, ***p < 0.001, as compared to the NC group")
![Phospho-PI3K p85 (Tyr458)[Tyr467]/p55 (Tyr199) Antibody - Figure 7 Western blot detected the effects of oeKRT23 and PI3K-IN-1 intervention on EMT and PI3K/AKT/mTOR signaling pathway.](http://img.affbiotech.cn/uploads/202604/b9d69a2f54ea50e924541e018129e4c1.png "Figure 7 Western blot detected the effects of oeKRT23 and PI3K-IN-1 intervention on EMT and PI3K/AKT/mTOR signaling pathway. (A) EMT, PI3K/AKT/mTOR pathways, and EMT transcription factor protein bands. (B-H) Expression levels of E-cadherin, N-cadherin, p-PI3K, p-AKT, p-mTOR, Snail, and Twistl in each group. E-cadherin protein: oeKRT23 vs. oeNC: MGC803, P=0.04; SGC7901, P=0.005. N-cadherin, Snail, Twist1, p-PI3K, p-AKT, and p-mTOR proteins: oeKRT23 vs. NC: MGC803, N-cadherin (P=0.004), Snail (P=0.003), Twist1 (P=0.009), p-PI3K (P=0.009), p-AKT (P=0.008), and p-mTOR (P=0.005); SGC7901, N-cadherin (P=0.006), Snail (P=0.004), Twist1 (P=0.001), p-PI3K (P=0.009), p-AKT (P=0.009), and p-mTOR (P=0.008). AKT, protein kinase B; EMT, epithelial-mesenchymal transition; KRT23, keratin 23; mTOR, mammalian target of rapamycin; NC, normal control; oeKRT23, KRT23 overexpression; oeNC, NC overexpression; p-, phospho-; PI3K, phosphatidylinositol 3-kinase.")
| Product: | Phospho-PI3K p85 (Tyr458)[Tyr467]/p55 (Tyr199) Antibody |
| Catalog: | AF3242 |
| Description: | Rabbit polyclonal antibody to Phospho-PI3K p85 (Tyr458)[Tyr467]/p55 (Tyr199) |
| Application: | WB IHC IF/ICC |
| Cited expt.: | WB, IHC, IF/ICC |
| Reactivity: | Human, Mouse, Rat, Monkey |
| Prediction: | Zebrafish, Bovine, Horse, Sheep, Rabbit, Dog, Chicken, Xenopus |
| Mol.Wt.: | 54kDa,84kDa(Observed); 84kD,54kD(Calculated). |
| Uniprot: | P27986 | Q92569 |
| RRID: | AB_2834668 |
Related Downloads
Protocols
Product Info
*The optimal dilutions should be determined by the end user. For optimal experimental results, antibody reuse is not recommended.
*Tips:
WB: For western blot detection of denatured protein samples. IHC: For immunohistochemical detection of paraffin sections (IHC-p) or frozen sections (IHC-f) of tissue samples. IF/ICC: For immunofluorescence detection of cell samples. ELISA(peptide): For ELISA detection of antigenic peptide.
Cite Format: Affinity Biosciences Cat# AF3242, RRID:AB_2834668.
Fold/Unfold
GRB 1; GRB1; p85 alpha; p85; P85A_HUMAN; Phosphatidylinositol 3 kinase associated p 85 alpha; Phosphatidylinositol 3 kinase regulatory 1; Phosphatidylinositol 3 kinase regulatory subunit alpha; Phosphatidylinositol 3 kinase regulatory subunit polypeptide 1 (p85 alpha); Phosphatidylinositol 3-kinase 85 kDa regulatory subunit alpha; Phosphatidylinositol 3-kinase regulatory subunit alpha; Phosphoinositide 3 kinase regulatory subunit 1 (alpha); Phosphoinositide 3 kinase regulatory subunit 1 (p85 alpha); Phosphoinositide 3 kinase regulatory subunit 1; Phosphoinositide 3 kinase regulatory subunit polypeptide 1 (p85 alpha); PI3 kinase p85 subunit alpha; PI3-kinase regulatory subunit alpha; PI3-kinase subunit p85-alpha; PI3K; PI3K regulatory subunit alpha; Pik3r1; PtdIns 3 kinase p85 alpha; PtdIns-3-kinase regulatory subunit alpha; PtdIns-3-kinase regulatory subunit p85-alpha; DKFZp686P05226; FLJ41892; OTTHUMP00000009783; OTTHUMP00000009786; p55; p55 gamma; P55G_HUMAN; p55PIK; Phosphatidylinositol 3 kinase regulatory subunit gamma; Phosphatidylinositol 3 kinase regulatory subunit polypeptide 3; Phosphatidylinositol 3 kinase, regulatory subunit, polypeptide 3 (p55, gamma); Phosphatidylinositol 3-kinase 55 kDa regulatory subunit gamma; Phosphatidylinositol 3-kinase regulatory subunit gamma; Phosphoinositide 3 kinase regulatory subunit 3 (gamma); Phosphoinositide 3 kinase regulatory subunit 3; Phosphoinositide 3 kinase regulatory subunit polypeptide 3; Phosphoinositide 3 kinase, regulatory subunit 3 (p55, gamma); Phosphoinositide 3 kinase, regulatory subunit, polypeptide 3 (p55, gamma); PI3 kinase p85 subunit gamma; PI3-kinase regulatory subunit gamma; PI3-kinase subunit p55-gamma; PI3K regulatory subunit gamma; Pik3r3; PtdIns 3 kinase p85 gamma; PtdIns-3-kinase regulatory subunit gamma; PtdIns-3-kinase regulatory subunit p55-gamma;
Immunogens
A synthesized peptide derived from human PI3-kinase p85/p55 around the phosphorylation site of Tyr467/199.
Isoform 2 is expressed in skeletal muscle and brain, and at lower levels in kidney and cardiac muscle. Isoform 2 and isoform 4 are present in skeletal muscle (at protein level).
Q92569 P55G_HUMAN:Highest levels in brain and testis. Lower levels in adipose tissue, kidney, heart, lung and skeletal muscle.
- P27986 P85A_HUMAN:
- Protein BLAST With
- NCBI/
- ExPASy/
- Uniprot
MSAEGYQYRALYDYKKEREEDIDLHLGDILTVNKGSLVALGFSDGQEARPEEIGWLNGYNETTGERGDFPGTYVEYIGRKKISPPTPKPRPPRPLPVAPGSSKTEADVEQQALTLPDLAEQFAPPDIAPPLLIKLVEAIEKKGLECSTLYRTQSSSNLAELRQLLDCDTPSVDLEMIDVHVLADAFKRYLLDLPNPVIPAAVYSEMISLAPEVQSSEEYIQLLKKLIRSPSIPHQYWLTLQYLLKHFFKLSQTSSKNLLNARVLSEIFSPMLFRFSAASSDNTENLIKVIEILISTEWNERQPAPALPPKPPKPTTVANNGMNNNMSLQDAEWYWGDISREEVNEKLRDTADGTFLVRDASTKMHGDYTLTLRKGGNNKLIKIFHRDGKYGFSDPLTFSSVVELINHYRNESLAQYNPKLDVKLLYPVSKYQQDQVVKEDNIEAVGKKLHEYNTQFQEKSREYDRLYEEYTRTSQEIQMKRTAIEAFNETIKIFEEQCQTQERYSKEYIEKFKREGNEKEIQRIMHNYDKLKSRISEIIDSRRRLEEDLKKQAAEYREIDKRMNSIKPDLIQLRKTRDQYLMWLTQKGVRQKKLNEWLGNENTEDQYSLVEDDEDLPHHDEKTWNVGSSNRNKAENLLRGKRDGTFLVRESSKQGCYACSVVVDGEVKHCVINKTATGYGFAEPYNLYSSLKELVLHYQHTSLVQHNDSLNVTLAYPVYAQQRR
- Q92569 P55G_HUMAN:
- Protein BLAST With
- NCBI/
- ExPASy/
- Uniprot
MYNTVWSMDRDDADWREVMMPYSTELIFYIEMDPPALPPKPPKPMTSAVPNGMKDSSVSLQDAEWYWGDISREEVNDKLRDMPDGTFLVRDASTKMQGDYTLTLRKGGNNKLIKIYHRDGKYGFSDPLTFNSVVELINHYHHESLAQYNPKLDVKLMYPVSRYQQDQLVKEDNIDAVGKKLQEYHSQYQEKSKEYDRLYEEYTRTSQEIQMKRTAIEAFNETIKIFEEQCHTQEQHSKEYIERFRREGNEKEIERIMMNYDKLKSRLGEIHDSKMRLEQDLKNQALDNREIDKKMNSIKPDLIQLRKIRDQHLVWLNHKGVRQKRLNVWLGIKNEDADENYFINEEDENLPHYDEKTWFVEDINRVQAEDLLYGKPDGAFLIRESSKKGCYACSVVADGEVKHCVIYSTARGYGFAEPYNLYSSLKELVLHYQQTSLVQHNDSLNVRLAYPVHAQMPSLCR
Predictions
Score>80(red) has high confidence and is suggested to be used for WB detection. *The prediction model is mainly based on the alignment of immunogen sequences, the results are for reference only, not as the basis of quality assurance.
High(score>80) Medium(80>score>50) Low(score<50) No confidence
Research Backgrounds
Binds to activated (phosphorylated) protein-Tyr kinases, through its SH2 domain, and acts as an adapter, mediating the association of the p110 catalytic unit to the plasma membrane. Necessary for the insulin-stimulated increase in glucose uptake and glycogen synthesis in insulin-sensitive tissues. Plays an important role in signaling in response to FGFR1, FGFR2, FGFR3, FGFR4, KITLG/SCF, KIT, PDGFRA and PDGFRB. Likewise, plays a role in ITGB2 signaling. Modulates the cellular response to ER stress by promoting nuclear translocation of XBP1 isoform 2 in a ER stress- and/or insulin-dependent manner during metabolic overloading in the liver and hence plays a role in glucose tolerance improvement.
Polyubiquitinated in T-cells by CBLB; which does not promote proteasomal degradation but impairs association with CD28 and CD3Z upon T-cell activation.
Phosphorylated. Tyrosine phosphorylated in response to signaling by FGFR1, FGFR2, FGFR3 and FGFR4. Phosphorylated by CSF1R. Phosphorylated by ERBB4. Phosphorylated on tyrosine residues by TEK/TIE2. Dephosphorylated by PTPRJ. Phosphorylated by PIK3CA at Ser-608; phosphorylation is stimulated by insulin and PDGF. The relevance of phosphorylation by PIK3CA is however unclear (By similarity). Phosphorylated in response to KIT and KITLG/SCF. Phosphorylated by FGR.
Isoform 2 is expressed in skeletal muscle and brain, and at lower levels in kidney and cardiac muscle. Isoform 2 and isoform 4 are present in skeletal muscle (at protein level).
The SH3 domain mediates the binding to CBLB, and to HIV-1 Nef.
Belongs to the PI3K p85 subunit family.
Binds to activated (phosphorylated) protein-tyrosine kinases through its SH2 domain and regulates their kinase activity. During insulin stimulation, it also binds to IRS-1.
Highest levels in brain and testis. Lower levels in adipose tissue, kidney, heart, lung and skeletal muscle.
Belongs to the PI3K p85 subunit family.
Research Fields
· Cellular Processes > Transport and catabolism > Autophagy - animal. (View pathway)
· Cellular Processes > Cell growth and death > Apoptosis. (View pathway)
· Cellular Processes > Cell growth and death > Cellular senescence. (View pathway)
· Cellular Processes > Cellular community - eukaryotes > Focal adhesion. (View pathway)
· Cellular Processes > Cellular community - eukaryotes > Signaling pathways regulating pluripotency of stem cells. (View pathway)
· Cellular Processes > Cell motility > Regulation of actin cytoskeleton. (View pathway)
· Environmental Information Processing > Signal transduction > ErbB signaling pathway. (View pathway)
· Environmental Information Processing > Signal transduction > Ras signaling pathway. (View pathway)
· Environmental Information Processing > Signal transduction > Rap1 signaling pathway. (View pathway)
· Environmental Information Processing > Signal transduction > cAMP signaling pathway. (View pathway)
· Environmental Information Processing > Signal transduction > HIF-1 signaling pathway. (View pathway)
· Environmental Information Processing > Signal transduction > FoxO signaling pathway. (View pathway)
· Environmental Information Processing > Signal transduction > Phosphatidylinositol signaling system.
· Environmental Information Processing > Signal transduction > Sphingolipid signaling pathway. (View pathway)
· Environmental Information Processing > Signal transduction > Phospholipase D signaling pathway. (View pathway)
· Environmental Information Processing > Signal transduction > mTOR signaling pathway. (View pathway)
· Environmental Information Processing > Signal transduction > PI3K-Akt signaling pathway. (View pathway)
· Environmental Information Processing > Signal transduction > AMPK signaling pathway. (View pathway)
· Environmental Information Processing > Signal transduction > Jak-STAT signaling pathway. (View pathway)
· Environmental Information Processing > Signal transduction > TNF signaling pathway. (View pathway)
· Human Diseases > Drug resistance: Antineoplastic > EGFR tyrosine kinase inhibitor resistance.
· Human Diseases > Drug resistance: Antineoplastic > Endocrine resistance.
· Human Diseases > Drug resistance: Antineoplastic > Platinum drug resistance.
· Human Diseases > Endocrine and metabolic diseases > Type II diabetes mellitus.
· Human Diseases > Endocrine and metabolic diseases > Insulin resistance.
· Human Diseases > Endocrine and metabolic diseases > Non-alcoholic fatty liver disease (NAFLD).
· Human Diseases > Infectious diseases: Bacterial > Bacterial invasion of epithelial cells.
· Human Diseases > Infectious diseases: Parasitic > Chagas disease (American trypanosomiasis).
· Human Diseases > Infectious diseases: Parasitic > Amoebiasis.
· Human Diseases > Infectious diseases: Viral > Hepatitis C.
· Human Diseases > Infectious diseases: Viral > Hepatitis B.
· Human Diseases > Infectious diseases: Viral > Measles.
· Human Diseases > Infectious diseases: Viral > Influenza A.
· Human Diseases > Infectious diseases: Viral > Human papillomavirus infection.
· Human Diseases > Infectious diseases: Viral > HTLV-I infection.
· Human Diseases > Infectious diseases: Viral > Epstein-Barr virus infection.
· Human Diseases > Cancers: Overview > Pathways in cancer. (View pathway)
· Human Diseases > Cancers: Overview > Viral carcinogenesis.
· Human Diseases > Cancers: Overview > Proteoglycans in cancer.
· Human Diseases > Cancers: Specific types > Colorectal cancer. (View pathway)
· Human Diseases > Cancers: Specific types > Renal cell carcinoma. (View pathway)
· Human Diseases > Cancers: Specific types > Pancreatic cancer. (View pathway)
· Human Diseases > Cancers: Specific types > Endometrial cancer. (View pathway)
· Human Diseases > Cancers: Specific types > Glioma. (View pathway)
· Human Diseases > Cancers: Specific types > Prostate cancer. (View pathway)
· Human Diseases > Cancers: Specific types > Melanoma. (View pathway)
· Human Diseases > Cancers: Specific types > Chronic myeloid leukemia. (View pathway)
· Human Diseases > Cancers: Specific types > Acute myeloid leukemia. (View pathway)
· Human Diseases > Cancers: Specific types > Small cell lung cancer. (View pathway)
· Human Diseases > Cancers: Specific types > Non-small cell lung cancer. (View pathway)
· Human Diseases > Cancers: Specific types > Breast cancer. (View pathway)
· Human Diseases > Cancers: Specific types > Hepatocellular carcinoma. (View pathway)
· Human Diseases > Cancers: Specific types > Gastric cancer. (View pathway)
· Human Diseases > Cancers: Overview > Central carbon metabolism in cancer. (View pathway)
· Human Diseases > Cancers: Overview > Choline metabolism in cancer. (View pathway)
· Organismal Systems > Immune system > Chemokine signaling pathway. (View pathway)
· Organismal Systems > Aging > Longevity regulating pathway. (View pathway)
· Organismal Systems > Aging > Longevity regulating pathway - multiple species. (View pathway)
· Organismal Systems > Development > Axon guidance. (View pathway)
· Organismal Systems > Development > Osteoclast differentiation. (View pathway)
· Organismal Systems > Immune system > Platelet activation. (View pathway)
· Organismal Systems > Immune system > Toll-like receptor signaling pathway. (View pathway)
· Organismal Systems > Immune system > Natural killer cell mediated cytotoxicity. (View pathway)
· Organismal Systems > Immune system > T cell receptor signaling pathway. (View pathway)
· Organismal Systems > Immune system > B cell receptor signaling pathway. (View pathway)
· Organismal Systems > Immune system > Fc epsilon RI signaling pathway. (View pathway)
· Organismal Systems > Immune system > Fc gamma R-mediated phagocytosis. (View pathway)
· Organismal Systems > Immune system > Leukocyte transendothelial migration. (View pathway)
· Organismal Systems > Nervous system > Neurotrophin signaling pathway. (View pathway)
· Organismal Systems > Nervous system > Cholinergic synapse.
· Organismal Systems > Sensory system > Inflammatory mediator regulation of TRP channels. (View pathway)
· Organismal Systems > Endocrine system > Insulin signaling pathway. (View pathway)
· Organismal Systems > Endocrine system > Progesterone-mediated oocyte maturation.
· Organismal Systems > Endocrine system > Estrogen signaling pathway. (View pathway)
· Organismal Systems > Endocrine system > Prolactin signaling pathway. (View pathway)
· Organismal Systems > Endocrine system > Thyroid hormone signaling pathway. (View pathway)
· Organismal Systems > Endocrine system > Regulation of lipolysis in adipocytes.
· Organismal Systems > Endocrine system > Relaxin signaling pathway.
· Organismal Systems > Excretory system > Aldosterone-regulated sodium reabsorption.
· Organismal Systems > Digestive system > Carbohydrate digestion and absorption.
References

Application: WB Species: Rat Sample: heart tissue

Application: WB Species: Rat Sample:

Application: WB Species: human Sample: BMSCs

Application: WB Species: Mouse Sample:

Application: WB Species: Rat Sample: chondrocytes
Restrictive clause
Affinity Biosciences tests all products strictly. Citations are provided as a resource for additional applications that have not been validated by Affinity Biosciences. Please choose the appropriate format for each application and consult Materials and Methods sections for additional details about the use of any product in these publications.
For Research Use Only.
Not for use in diagnostic or therapeutic procedures. Not for resale. Not for distribution without written consent. Affinity Biosciences will not be held responsible for patent infringement or other violations that may occur with the use of our products. Affinity Biosciences, Affinity Biosciences Logo and all other trademarks are the property of Affinity Biosciences LTD.