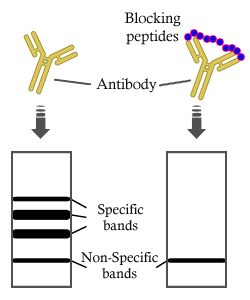
Product: CD16 Antibody
Catalog: DF7007
Description: Rabbit polyclonal antibody to CD16
Application: WB IHC
Reactivity: Human, Mouse, Rat
Mol.Wt.: 29kD, 50kD; 29kD(Calculated).
Uniprot: P08637
RRID: AB_2838963

View similar products>>

   Size Price Inventory
 100ul $280 In stock
 200ul $350 In stock

Lead Time: Same day delivery

For pricing and ordering contact:
Local distributors

Product Info

Source:
Rabbit
Application:
WB 1:500-1:2000, IHC 1:50-1:200
*The optimal dilutions should be determined by the end user.
*Tips:

WB: For western blot detection of denatured protein samples. IHC: For immunohistochemical detection of paraffin sections (IHC-p) or frozen sections (IHC-f) of tissue samples. IF/ICC: For immunofluorescence detection of cell samples. ELISA(peptide): For ELISA detection of antigenic peptide.

Reactivity:
Human,Mouse,Rat
Clonality:
Polyclonal
Specificity:
CD16 Antibody detects endogenous levels of total CD16.
RRID:
AB_2838963
Cite Format: Affinity Biosciences Cat# DF7007, RRID:AB_2838963.
Conjugate:
Unconjugated.
Purification:
The antiserum was purified by peptide affinity chromatography using SulfoLink™ Coupling Resin (Thermo Fisher Scientific).
Storage:
Rabbit IgG in phosphate buffered saline , pH 7.4, 150mM NaCl, 0.02% sodium azide and 50% glycerol. Store at -20 °C. Stable for 12 months from date of receipt.
Alias:

Fold/Unfold

CD 16; CD 16a; CD16; CD16a; CD16a antigen; CD16B; CD16b antigen; Fc fragment of IgG; Fc fragment of IgG low affinity IIIa receptor (CD16); Fc fragment of IgG low affinity IIIa receptor; Fc fragment of IgG receptor IIIa; Fc fragment of IgG, low affinity III, receptor (CD16); Fc fragment of IgG, low affinity III, receptor for (CD16); Fc fragment of IgG, low affinity IIIa, receptor (CD16); Fc fragment of IgG, low affinity IIIa, receptor (CD16a); Fc fragment of IgG, low affinity IIIa, receptor for; Fc fragment of IgG, low affinity IIIb, receptor (CD16b); Fc fragment of IgG, low affinity IIIb, receptor for (CD16); Fc gamma R3; Fc gamma receptor III 2 (CD 16); Fc gamma receptor III A; Fc gamma receptor IIIA; Fc gamma receptor IIIb (CD 16); Fc gamma RIII alpha; Fc gamma RIII; Fc gamma RIII beta; Fc gamma RIIIa; Fc gamma RIIIb; Fc of IgG; Fc-gamma receptor III2 (CD 16); Fc-gamma receptor III2 (CD16); Fc-gamma receptor IIIb (CD16); Fc-gamma RIII; Fc-gamma RIII-alpha; Fc-gamma RIIIa; FCG 3; FCG3; FCG3A_HUMAN; FCgammaRIIIA; FCGR 3; FCGR 3A; FCGR3; FCGR3A; FCGR3A protein; FCGRIII; FCGRIII-2; FcR 10; FcR-10; FcR10; FcRIII; FcRIIIa; IGFR 3; IGFR3; IgG Fc receptor III 1; IgG Fc receptor III 2; IgG Fc receptor III-2; IMD20; immunoglobulin G Fc receptor III; immunoglobulin G Fc receptor III-2; Low affinity IIIa receptor; Low affinity immunoglobulin gamma Fc region receptor III A; Low affinity immunoglobulin gamma Fc region receptor III-A; Low affinity immunoglobulin gamma Fc region receptor IIIB; neutrophil-specific antigen NA;

Immunogens

Immunogen:
Uniprot:
Gene(ID):
Expression:
P08637 FCG3A_HUMAN:

Expressed on natural killer cells, macrophages, subpopulation of T-cells, immature thymocytes and placental trophoblasts.

Description:
This gene encodes a receptor for the Fc portion of immunoglobulin G, and it is involved in the removal of antigen-antibody complexes from the circulation, as well as other other antibody-dependent responses. This gene (FCGR3A) is highly similar to another nearby gene (FCGR3B) located on chromosome 1. The receptor encoded by this gene is expressed on natural killer (NK) cells as an integral membrane glycoprotein anchored through a transmembrane peptide, whereas FCGR3B is expressed on polymorphonuclear neutrophils (PMN) where the receptor is anchored through a phosphatidylinositol (PI) linkage. Mutations in this gene have been linked to susceptibility to recurrent viral infections, susceptibility to systemic lupus erythematosus, and alloimmune neonatal neutropenia. Alternatively spliced transcript variants encoding different isoforms have been found for this gene.
Sequence:
MWQLLLPTALLLLVSAGMRTEDLPKAVVFLEPQWYRVLEKDSVTLKCQGAYSPEDNSTQWFHNESLISSQASSYFIDAATVDDSGEYRCQTNLSTLSDPVQLEVHIGWLLLQAPRWVFKEEDPIHLRCHSWKNTALHKVTYLQNGKGRKYFHHNSDFYIPKATLKDSGSYFCRGLFGSKNVSSETVNITITQGLAVSTISSFFPPGYQVSFCLVMVLLFAVDTGLYFSVKTNIRSSTRDWKDHKFKWRKDPQDK

PTMs - P08637 As Substrate

Site PTM Type Enzyme
N63 N-Glycosylation
T163 Phosphorylation
S167 Phosphorylation
S169 Phosphorylation
Y170 Phosphorylation
N180 N-Glycosylation

PTMs - P08637 As Enzyme

Substrate Site Source
P06239-1 (LCK) Y394 Uniprot

Research Backgrounds

Function:

Receptor for the Fc region of IgG. Binds complexed or aggregated IgG and also monomeric IgG. Mediates antibody-dependent cellular cytotoxicity (ADCC) and other antibody-dependent responses, such as phagocytosis.

PTMs:

Glycosylated. Contains high mannose- and complex-type oligosaccharides. Glycosylation at Asn-180 is mandatory for high affinity binding to the Fc and for discrimination between fucosylated and afucosylated IgG glycoforms.

The soluble form is produced by a proteolytic cleavage.

Subcellular Location:

Cell membrane>Single-pass type I membrane protein. Secreted.
Note: Exists also as a soluble receptor.

Extracellular region or secreted Cytosol Plasma membrane Cytoskeleton Lysosome Endosome Peroxisome ER Golgi apparatus Nucleus Mitochondrion Manual annotation Automatic computational assertionSubcellular location
Tissue Specificity:

Expressed on natural killer cells, macrophages, subpopulation of T-cells, immature thymocytes and placental trophoblasts.

Subunit Structure:

Exists as a heterooligomeric receptor complex with Fc epsilon receptor I gamma subunit and / or the CD3 zeta subunit. Interacts with INPP5D/SHIP1 (By similarity).

Research Fields

· Cellular Processes > Transport and catabolism > Phagosome.   (View pathway)

· Human Diseases > Infectious diseases: Parasitic > Leishmaniasis.

· Human Diseases > Infectious diseases: Bacterial > Staphylococcus aureus infection.

· Human Diseases > Infectious diseases: Bacterial > Tuberculosis.

· Human Diseases > Immune diseases > Systemic lupus erythematosus.

· Organismal Systems > Development > Osteoclast differentiation.   (View pathway)

· Organismal Systems > Immune system > Natural killer cell mediated cytotoxicity.   (View pathway)

· Organismal Systems > Immune system > Fc gamma R-mediated phagocytosis.   (View pathway)

References

1). SIRPα antibody combined with oncolytic virus OH2 protects against tumours by activating innate immunity and reprogramming the tumour immune microenvironment. BMC Medicine (PubMed: 36310169) [IF=9.3]

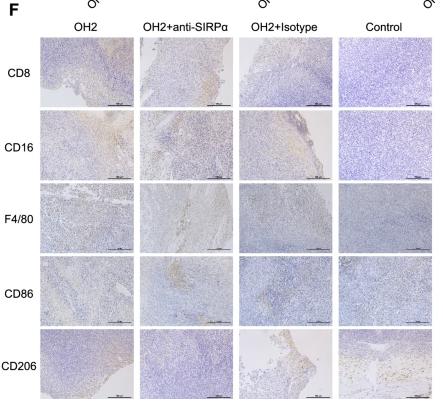
Application: IHC    Species: Mouse    Sample:

Fig. 5M-IHC and IHC staining of the anti-SIRPα antibody treatment model. A Representative M-IHC results of the OH2 combined anti-SIRPα antibody group, OH2 combined isotype, OH2 group, and control group with larger tumour volume sat the initial treatment. CD8, green, CD16, sky blue, F4/80, purple, CD86, orange, and CD206, red. Scale bar, 100μm. B Quantitative results of NK cell (CD16) staining in the OH2 combined anti-SIRPα antibody group, OH2 combined isotype, OH2 group, and control group. n=3 samples/group. C Quantitative result of M2 macrophage (F4/80+CD206+) staining in the OH2 combined anti-SIRPα antibody group, OH2 combined isotype, OH2 group, and control group. n=3 samples/group. D Quantitative results of M1 macrophage (F4/80+CD86+) staining in the OH2 combined anti-SIRPα antibody group, OH2 combined isotype, OH2 group, and control group. n=3 samples/group. E Quantitative results of CD8 T cell staining in the OH2 combined anti-SIRPα antibody group, OH2 combined Isotype, OH2 group, and control group. n=3 samples/group. F Representative IHC staining for CD8, CD16, F4/80, CD86, and CD206 of the OH2 combined anti-SIRPα antibody group, OH2 combined isotype group, OH2 group, and control group with larger tumour volumes at the initial treatment. Original magnification, ×200. n=5 samples/group. G Quantitative results of CD8, CD16, F4/80, CD86 and CD206 staining in the OH2 combined anti-SIRPα antibody group, OH2 combined isotype, OH2 group and control group. n=5 samples/group. Statistical analysis was performed using ANOVA with multiple comparisons. ns, no significant differences, *, p<0.05, **, p<0.01, ***, p<0.001, ****, p<0.0001 (proportion represented the percentage of the cell to the total number of cells)

2). Loganin alleviates macrophage infiltration and activation by inhibiting the MCP-1/CCR2 axis in diabetic nephropathy. LIFE SCIENCES (PubMed: 33245967) [IF=6.1]

Application: WB    Species: mice    Sample: RAW264.7 cells

Fig. 4 Effect of loganin on phenotypic transformation of macrophages. (A) The expressions of iNOS and CD16/32 in RAW264.7 cells were quantified. (B) The expressions of Arg-1 and CD206 in RAW264.7 cells were quantified. (C) The expression of iNOS in the kidney of DN mice was quantified. (D) The expression of CD206 in the kidney of DN mice was quantified. Representative results were obtained from at least three independent experiments. Data were expressed as mean ± SD. #P<0.05 and ##P<0.01 versus the normal group or the control group, *P<0.05 and **P<0.01 versus the model group or the AGEs group. The experiment was repeated three times.

3). Poly(ADP-ribose) polymerase family member 14 promotes functional recovery after spinal cord injury through regulating microglia M1/M2 polarization via STAT1/6 pathway. Neural Regeneration Research (PubMed: 36751810) [IF=6.1]

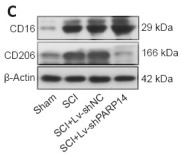
Application: WB    Species: Mouse    Sample:
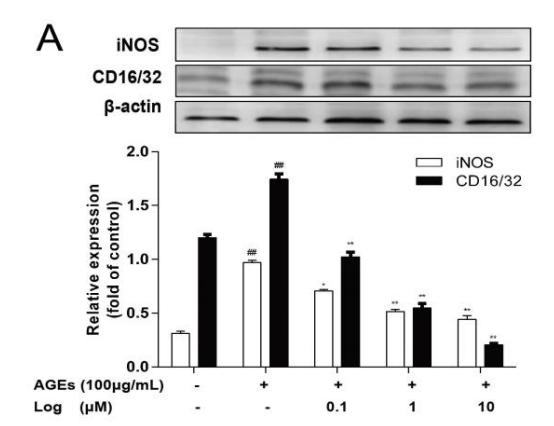
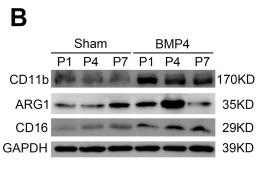
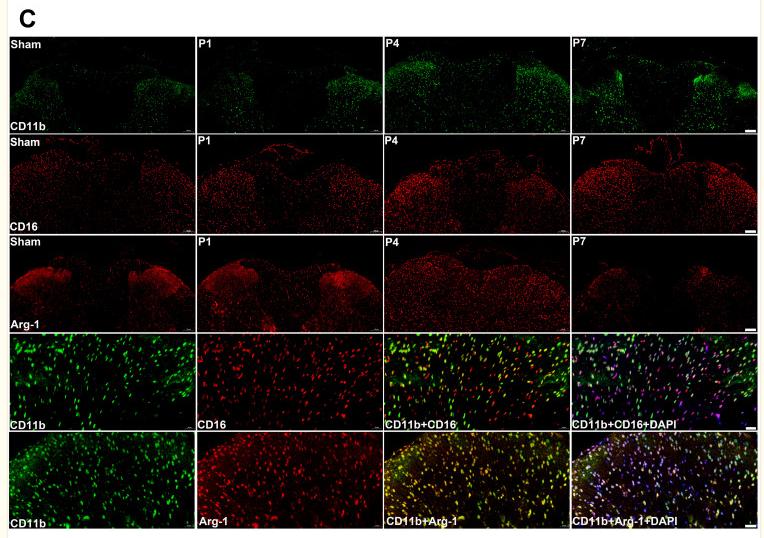
Figure 4 PARP14 deficiency exacerbates the shift of M2-polarized microglia to M1-polarized microglia in mice 7 days post-SCI. (A) Representative images and quantitative analysis showing iNOS+/Iba1+ immunofluorescence staining. Lv-shPARP14 injection enhanced the SCI-induced increase in iNOS expression (pro-inflammatory phenotype). White arrows indicate iNOS+ (green, FITC-labeled)/Iba1+ (red, Cy3-labeled, microglia marker) cells. (B) Representative images and quantitative analysis showing Arg-1+/Iba1+ immunofluorescence staining. Lv-shPARP14 injection reversed the SCI-induced increase in Arg-1 expression (anti-inflammatory phenotype). White arrows indicate Arg-1+ (green, FITC-labeled)/Iba1+ (red, Cy3-labeled, microglia marker) cells. Scale bars: 50 µm in A and B. (C) Relative protein expression of CD16 and CD206 in each group. Lv-shPARP14 injection enhanced the SCI-induced increase in CD16 (M1-type marker) expression and decreased the SCI-induced increase in CD206 (M2-type marker) expression. (D) The concentration of pro-inflammatory cytokines (TNF-α, IL-1β, and IL-6) and anti-inflammatory cytokines (IL-10, TGF-β1, and IL-4) in each group was measured by enzyme-linked immunosorbent assay. Lv-shPARP14 injection increased the concentration of pro-inflammatory cytokines but decreased anti-inflammatory cytokine accumulation. Values are shown as mean ± SD (n = 6). *P < 0.05, **P < 0.01 (one-way analysis of variance followed by Tukey’s post hoc test). Images were taken of the gray matter ventral horn at the injury site. Spinal cord tissues from the injury site were used for western blot and enzyme-linked immunosorbent assay detection. Arg-1: Arginase-1; DAPI: 4′,6-diamidino-2-phenylindole; FITC: fluorescein isothiocyanate; Iba1: ionized calcium-binding adaptor molecule 1; IL: interleukin; iNOS: inducible nitric oxide synthase; PARP14: poly(ADP-ribose)polymerase, member 14; SCI: spinal cord injury; TGF-β1: transforming growth factor-beta1; TNF-α: tumor necrosis factor alpha.

4). Caveolin-1 aggravates neurological deficits by activating neuroinflammation following experimental intracerebral hemorrhage in rats. Experimental Neurology (PubMed: 37598879) [IF=5.3]

5). Duzhong Fang Attenuates the POMC-Derived Neuroinflammation in Parkinsonian Mice. Journal of Inflammation Research (PubMed: 34326654) [IF=4.5]

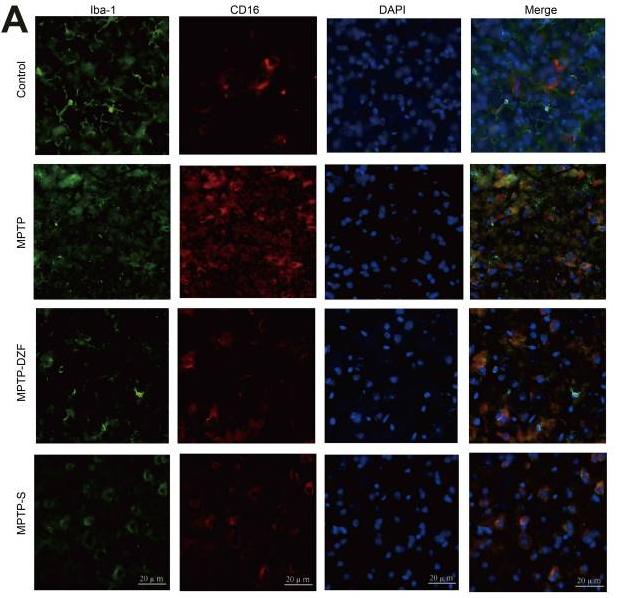
Application: IF/ICC    Species: Mice    Sample: midbrain tissue

Figure 6 Immunofluorescence double staining of inflammatory marker CD16 and anti-inflammatory marker CD206 on microglia in the substantia nigra of mice. (A) Staining of Iba-1 (green) and CD16 (classical microglia marker, red) in the SNpc and (B) quantification of the percentage of CD16+/Iba‐1+ cell. (C) Double staining of Iba-1 (microglia marker, green) and CD206 (alternative microglia marker, red) in the SNpc for immunofluorescence pictures and (D) quantification of the percentage of CD206+/Iba‐1+ cell. Scale bar is 20 µm. Data represent the means ± SEM; Statistics one-way ANOVA; ##P < 0.01, ###P < 0.001 vs Control group; *P < 0.05, vs MPTP group; n = 3.

6). The Role of Bone Morphogenetic Protein 4 in Microglial Polarization in the Process of Neuropathic Pain. Journal of Inflammation Research (PubMed: 35535051) [IF=4.5]

Application: WB    Species: Rat    Sample: spinal cord

Figure 1 Exogenous BMP4-induced allodynia, microglial activation and polarization. (A) PWT in rats after intrathecal BMP4 application showed a significant effect on time: F (4.143, 66.29) = 16.09, P<0.01, left; F (3.960, 63.35) = 12.67, P<0.01, right, intrathecal application: F (1, 16) = 161.3, P<0.01, left; F (1, 16) = 160.5, P<0.01, right and interaction: F (7, 112) = 11.76, P<0.01, left; F (7, 112) = 5.653, P<0.01, right. Compared with the Sham group, rats in the BMP4 group developed a significant decrease in bilateral PWT for the whole first week, P<0.01, n=9 at each time point for both groups. (B) Representative Western blotting showed a sustained increase of CD11b (P<0.01) and CD16 (P<0.01) expressions for the whole 1st week in the BMP4 group compared with the Sham group. Meanwhile, ARG-1 levels increased at day 1 (P<0.01) and day 4 (P<0.01), then fell below the levels of the Sham group (P<0.01). n=3 for each column. (C and D) Double-immunofluorescence further detected that compared with the Sham group (P7), CD11b expression was elevated in the dorsal horn of spinal cord after BMP4 treatment. Moreover, expressions of CD16 and ARG-1 showed similar pattern with Western blotting results, which were both mainly accumulated with CD11b+ cells. n=3 for each column. Two-way ANOVA, followed by a Bonferroni test (A) and one-way ANOVA, followed by Sidak’s multiple comparisons test (B–D) were performed to analyze the statistical differences. *Represented P<0.05 and **Represented P<0.01 compared with the Sham group.

Application: IF/ICC    Species: Rat    Sample: spinal cord

Figure 1 Exogenous BMP4-induced allodynia, microglial activation and polarization. (A) PWT in rats after intrathecal BMP4 application showed a significant effect on time: F (4.143, 66.29) = 16.09, P<0.01, left; F (3.960, 63.35) = 12.67, P<0.01, right, intrathecal application: F (1, 16) = 161.3, P<0.01, left; F (1, 16) = 160.5, P<0.01, right and interaction: F (7, 112) = 11.76, P<0.01, left; F (7, 112) = 5.653, P<0.01, right. Compared with the Sham group, rats in the BMP4 group developed a significant decrease in bilateral PWT for the whole first week, P<0.01, n=9 at each time point for both groups. (B) Representative Western blotting showed a sustained increase of CD11b (P<0.01) and CD16 (P<0.01) expressions for the whole 1st week in the BMP4 group compared with the Sham group. Meanwhile, ARG-1 levels increased at day 1 (P<0.01) and day 4 (P<0.01), then fell below the levels of the Sham group (P<0.01). n=3 for each column. (C and D) Double-immunofluorescence further detected that compared with the Sham group (P7), CD11b expression was elevated in the dorsal horn of spinal cord after BMP4 treatment. Moreover, expressions of CD16 and ARG-1 showed similar pattern with Western blotting results, which were both mainly accumulated with CD11b+ cells. n=3 for each column. Two-way ANOVA, followed by a Bonferroni test (A) and one-way ANOVA, followed by Sidak’s multiple comparisons test (B–D) were performed to analyze the statistical differences. *Represented P<0.05 and **Represented P<0.01 compared with the Sham group.

Restrictive clause


Affinity Biosciences tests all products strictly. Citations are provided as a resource for additional applications that have not been validated by Affinity Biosciences. Please choose the appropriate format for each application and consult Materials and Methods sections for additional details about the use of any product in these publications.

For Research Use Only.
Not for use in diagnostic or therapeutic procedures. Not for resale. Not for distribution without written consent. Affinity Biosciences will not be held responsible for patent infringement or other violations that may occur with the use of our products. Affinity Biosciences, Affinity Biosciences Logo and all other trademarks are the property of Affinity Biosciences LTD.