
, using GLUT1 Antibody at 1/1000 dilution.
5ug/NC membrane strip.
Exposure for 5s with Affinity™ ECL Kit(#KF8003).
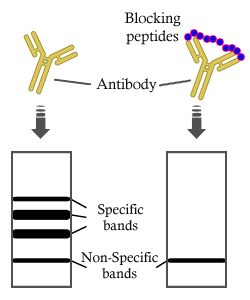
Bands result from membrane strip incubation.")


 GLUT1 protein expression level in 50 prostate cancer tissues were
detected by IHC. (B) Negative correlation between TXNIP and GLUT1 mRNA
expression patterns in prostate cancer tissues from TCGA cBioportal database. (C)
The mRNA expression level of GLUT1 in normal prostatic epithelial cell line and
prostate cancer cell lines was examined by qRT-PCR assay. (D and E) The protein
expression level of GLUT1 in normal prostatic epithelial cell line and prostate
cancer cell lines was examined by Western blot assay. (F) After overexpression of
TXNIP in PC-3 cells, the mRNA expression level of GLUT1 was examined by
qRT-PCR assay. (G and H) After overexpression of TXNIP in PC-3 cells, the
protein expression level of GLUT1 was examined by Western blot assay. (I) The
2-NBDG glucose uptake demonstrated that TXNIP overexpression suppressed
glucose uptake in PC-3 cells. The β-actin gene and protein were used as internal
controls. Data represented the mean ± standard deviation of 3 independent
experiments (*P < 0.05, **P < 0.01, ***P < 0.001).")
 HIF-1 and VEGFA expression in fraxetin-treated PANC-1 and Patu8988 cells as seen on a Western blot. (B) Western blot analysis of HIF-1 and VEGFA expression in fraxetin-treated animal xenograft models. (C) IHC staining for HIF-1α in fraxetin-treated models. Bar = 100 μm. (D–G) Glucose metabolism assay shows downregulated oxygen consumption rate (OCR), basal respiration, spare respiration, maximal respiration, and ATP production in fraxetin-treated PANC-1 and Patu8988 cells. (H–K) Glucose metabolism assay showing reduced levels of extracellular acidification rate (ECAR), basal glycolysis and compensatory glycolysis in fraxetin-treated PANC-1 and Patu8988 cells. (L) GLUT1 expression in fraxetin-treated PANC-1 and Patu8988 cells as seen on a Western blot. Data were presented as the mean ± standard deviation, and were analyzed by One-way ANOVA with Bonferroni’s post-hoc test and two-sided Student’s t-test. *P < 0.05; **P < 0.01, ***P < 0.001.")
 tissues and normal gastric specimens. Immunohistochemistry and western blot analysis were performed to examine the Bmi-1 and GLUT1 protein expression levels in GAC specimens (n = 4) and matched histologically normal gastric specimens (n = 4). Representative images of immunohistochemical staining of Bmi-1 in (a) GAC and (b) noncancerous control tissues (magnification, 400×). The yellow-brown color denotes positive Bmi-1 expression that is mainly located in the nucleus (arrows). Representative images of immunohistochemical staining of GLUT1 in (c) GAC and (d) noncancerous control tissues (magnification, 400×). GLUT1 is mainly localized in the cell membrane (arrows); (e) Western blot analysis of Bmi-1 and GLUT1 protein expressions in four paired tissues of GAC and noncancerous control tissues. The relative Bmi-1 and GLUT1 protein levels were normalized to GAPDH; (f) quantification of the Bmi-1 and GLUT1 protein expression levels in three independent experiments on the basis of the immunohistochemical and western blot images. The levels of Bmi-1 and GLUT1 were significantly greater in AGC tissues vs matched adjacent noncancerous tissues (3.903 ± 0.9363 vs 1.613 ± 0.760 and 2.480 ± 1.276 vs 1.945 ± 0.230, respectively) (All P < 0.05). T, tumor tissues; P, paracancerous, noncancerous tissues.")
 tissues and normal gastric specimens. Immunohistochemistry and western blot analysis were performed to examine the Bmi-1 and GLUT1 protein expression levels in GAC specimens (n = 4) and matched histologically normal gastric specimens (n = 4). Representative images of immunohistochemical staining of Bmi-1 in (a) GAC and (b) noncancerous control tissues (magnification, 400×). The yellow-brown color denotes positive Bmi-1 expression that is mainly located in the nucleus (arrows). Representative images of immunohistochemical staining of GLUT1 in (c) GAC and (d) noncancerous control tissues (magnification, 400×). GLUT1 is mainly localized in the cell membrane (arrows); (e) Western blot analysis of Bmi-1 and GLUT1 protein expressions in four paired tissues of GAC and noncancerous control tissues. The relative Bmi-1 and GLUT1 protein levels were normalized to GAPDH; (f) quantification of the Bmi-1 and GLUT1 protein expression levels in three independent experiments on the basis of the immunohistochemical and western blot images. The levels of Bmi-1 and GLUT1 were significantly greater in AGC tissues vs matched adjacent noncancerous tissues (3.903 ± 0.9363 vs 1.613 ± 0.760 and 2.480 ± 1.276 vs 1.945 ± 0.230, respectively) (All P < 0.05). T, tumor tissues; P, paracancerous, noncancerous tissues.")
. B: Quantification of expression level of SLC2A1 in aortic roots. C: Western blotting for SLC2A1 in BMDMs with the intervention of HLJDD. D: Densitometric analysis of SLC2A1 in aorta (n = 3). E: Western blotting for SLC2A1 in BMDMs with the intervention of STF31 (an inhibitor of SLC2A1). F: Western blotting for SLC2A1 in BMDMs with the intervention of HLJDD and STF31. G: Densitometric analysis of SLC2A1 in BMDMs (n = 3). H: Relatively mRNA expression levels of TYRO3, AXL, and MERTK in BMDMs (n = 5). I: Western blotting for TYRO3, AXL, and MERTK in BMDMs. J: Densitometric analysis of TYRO3, AXL, and MERTK in BMDMs (n = 3). K: The co-localization of BMDMs and apoptotic VSMCs with the intervention of HLJDD and STF31 (scale bar: 100 µm). L: The statistical chart of efferocytosis index (n = 3). *P<0.05, **P<0.01, ***P<0.001.")
. B: Quantification of expression level of SLC2A1 in aortic roots. C: Western blotting for SLC2A1 in BMDMs with the intervention of HLJDD. D: Densitometric analysis of SLC2A1 in aorta (n = 3). E: Western blotting for SLC2A1 in BMDMs with the intervention of STF31 (an inhibitor of SLC2A1). F: Western blotting for SLC2A1 in BMDMs with the intervention of HLJDD and STF31. G: Densitometric analysis of SLC2A1 in BMDMs (n = 3). H: Relatively mRNA expression levels of TYRO3, AXL, and MERTK in BMDMs (n = 5). I: Western blotting for TYRO3, AXL, and MERTK in BMDMs. J: Densitometric analysis of TYRO3, AXL, and MERTK in BMDMs (n = 3). K: The co-localization of BMDMs and apoptotic VSMCs with the intervention of HLJDD and STF31 (scale bar: 100 µm). L: The statistical chart of efferocytosis index (n = 3). *P<0.05, **P<0.01, ***P<0.001.")

| Product: | GLUT1 Antibody |
| Catalog: | AF5462 |
| Description: | Rabbit polyclonal antibody to GLUT1 |
| Application: | WB IHC IF/ICC |
| Cited expt.: | WB, IHC, IF/ICC |
| Reactivity: | Human, Mouse, Rat |
| Prediction: | Pig, Bovine, Horse, Sheep, Rabbit, Dog, Chicken |
| Mol.Wt.: | 45-60kDa(Observed); 54kD(Calculated). |
| Uniprot: | P11166 |
| RRID: | AB_2837946 |
Control Products
Product Info
*The optimal dilutions should be determined by the end user. For optimal experimental results, antibody reuse is not recommended.
*Tips:
WB: For western blot detection of denatured protein samples. IHC: For immunohistochemical detection of paraffin sections (IHC-p) or frozen sections (IHC-f) of tissue samples. IF/ICC: For immunofluorescence detection of cell samples. ELISA(peptide): For ELISA detection of antigenic peptide.
Cite Format: Affinity Biosciences Cat# AF5462, RRID:AB_2837946.
Fold/Unfold
Choreoathetosis/spasticity episodic (paroxysmal choreoathetosis/spasticity); CSE; DYT17; DYT18; DYT9; EIG12; erythrocyte/brain; Erythrocyte/hepatoma glucose transporter; facilitated glucose transporter member 1; Glucose transporter 1; Glucose transporter type 1; Glucose transporter type 1, erythrocyte/brain; GLUT; GLUT-1; GLUT1; GLUT1DS; GLUTB; GT1; GTG1; Gtg3; GTR1_HUMAN; HepG2 glucose transporter; HTLVR; Human T cell leukemia virus (I and II) receptor; MGC141895; MGC141896; PED; RATGTG1; Receptor for HTLV 1 and HTLV 2; SLC2A1; Solute carrier family 2 (facilitated glucose transporter), member 1; Solute carrier family 2; Solute carrier family 2, facilitated glucose transporter member 1;
Immunogens
A synthesized peptide derived from human GLUT1, corresponding to a region within C-terminal amino acids.
Detected in erythrocytes (at protein level). Expressed at variable levels in many human tissues.
- P11166 GTR1_HUMAN:
- Protein BLAST With
- NCBI/
- ExPASy/
- Uniprot
MEPSSKKLTGRLMLAVGGAVLGSLQFGYNTGVINAPQKVIEEFYNQTWVHRYGESILPTTLTTLWSLSVAIFSVGGMIGSFSVGLFVNRFGRRNSMLMMNLLAFVSAVLMGFSKLGKSFEMLILGRFIIGVYCGLTTGFVPMYVGEVSPTALRGALGTLHQLGIVVGILIAQVFGLDSIMGNKDLWPLLLSIIFIPALLQCIVLPFCPESPRFLLINRNEENRAKSVLKKLRGTADVTHDLQEMKEESRQMMREKKVTILELFRSPAYRQPILIAVVLQLSQQLSGINAVFYYSTSIFEKAGVQQPVYATIGSGIVNTAFTVVSLFVVERAGRRTLHLIGLAGMAGCAILMTIALALLEQLPWMSYLSIVAIFGFVAFFEVGPGPIPWFIVAELFSQGPRPAAIAVAGFSNWTSNFIVGMCFQYVEQLCGPYVFIIFTVLLVLFFIFTYFKVPETKGRTFDEIASGFRQGGASQSDKTPEELFHPLGADSQV
Predictions
Score>80(red) has high confidence and is suggested to be used for WB detection. *The prediction model is mainly based on the alignment of immunogen sequences, the results are for reference only, not as the basis of quality assurance.
High(score>80) Medium(80>score>50) Low(score<50) No confidence
Research Backgrounds
Facilitative glucose transporter, which is responsible for constitutive or basal glucose uptake. Has a very broad substrate specificity; can transport a wide range of aldoses including both pentoses and hexoses. Most important energy carrier of the brain: present at the blood-brain barrier and assures the energy-independent, facilitative transport of glucose into the brain.
Phosphorylation at Ser-226 by PKC promotes glucose uptake by increasing cell membrane localization.
Cell membrane>Multi-pass membrane protein. Melanosome.
Note: Localizes primarily at the cell surface (PubMed:18245775, PubMed:19449892, PubMed:23219802, PubMed:25982116, PubMed:24847886). Identified by mass spectrometry in melanosome fractions from stage I to stage IV (PubMed:17081065).
Detected in erythrocytes (at protein level). Expressed at variable levels in many human tissues.
Belongs to the major facilitator superfamily. Sugar transporter (TC 2.A.1.1) family. Glucose transporter subfamily.
Research Fields
· Environmental Information Processing > Signal transduction > HIF-1 signaling pathway. (View pathway)
· Human Diseases > Endocrine and metabolic diseases > Insulin resistance.
· Human Diseases > Infectious diseases: Viral > HTLV-I infection.
· Human Diseases > Cancers: Overview > Pathways in cancer. (View pathway)
· Human Diseases > Cancers: Specific types > Renal cell carcinoma. (View pathway)
· Human Diseases > Cancers: Overview > Central carbon metabolism in cancer. (View pathway)
· Organismal Systems > Endocrine system > Insulin secretion. (View pathway)
· Organismal Systems > Endocrine system > Thyroid hormone signaling pathway. (View pathway)
· Organismal Systems > Endocrine system > Adipocytokine signaling pathway.
· Organismal Systems > Endocrine system > Glucagon signaling pathway.
References
Application: WB Species: human Sample: MIA PaCa-2 cells

Application: WB Species: human Sample: MDA-MB-468 cells
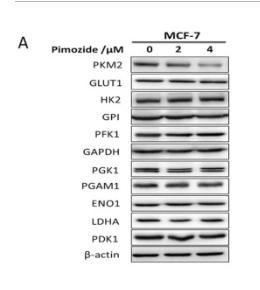
Application: WB Species: Human Sample: MCF-7 cells

Application: WB Species: human Sample: LC cells

Application: WB Species: Human Sample: Huh7 cells
Restrictive clause
Affinity Biosciences tests all products strictly. Citations are provided as a resource for additional applications that have not been validated by Affinity Biosciences. Please choose the appropriate format for each application and consult Materials and Methods sections for additional details about the use of any product in these publications.
For Research Use Only.
Not for use in diagnostic or therapeutic procedures. Not for resale. Not for distribution without written consent. Affinity Biosciences will not be held responsible for patent infringement or other violations that may occur with the use of our products. Affinity Biosciences, Affinity Biosciences Logo and all other trademarks are the property of Affinity Biosciences LTD.