
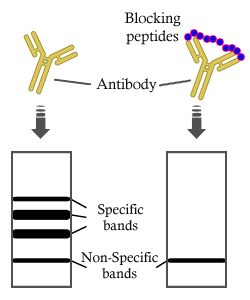
, using Leptin Receptor Antibody. The lane on the left was treated with blocking peptide.")
 and mouse anti-beta tubulin Ab(T0023 1:200) for 1 hour at 37°C. An AlexaFluor594 conjugated goat anti-rabbit IgG(H+L) Ab(Red) and an AlexaFluor488 conjugated goat anti-mouse IgG(H+L) Ab(Green) were used as the secondary antibody.
The nuclear counter stain is DAPI(blue).")
 Representative images of Iba-1+ cells, in the hippocampus sections of the mice. (E–G) Quantitative analysis of Iba-1+ stained cells.")
| Product: | Leptin Receptor Antibody |
| Catalog: | DF7139 |
| Description: | Rabbit polyclonal antibody to Leptin Receptor |
| Application: | WB IHC IF/ICC |
| Cited expt.: | WB, IHC |
| Reactivity: | Human, Mouse, Rat |
| Prediction: | Pig, Rabbit, Chicken |
| Mol.Wt.: | 96kDa(Observed); 132kD(Calculated). |
| Uniprot: | P48357 |
| RRID: | AB_2839093 |
Control Products
Related Downloads
Protocols
Product Info
*The optimal dilutions should be determined by the end user. For optimal experimental results, antibody reuse is not recommended.
*Tips:
WB: For western blot detection of denatured protein samples. IHC: For immunohistochemical detection of paraffin sections (IHC-p) or frozen sections (IHC-f) of tissue samples. IF/ICC: For immunofluorescence detection of cell samples. ELISA(peptide): For ELISA detection of antigenic peptide.
Cite Format: Affinity Biosciences Cat# DF7139, RRID:AB_2839093.
Fold/Unfold
CD 295; CD295; CD295 antigen; Db; Fa; HuB219; LEP R; LEP-R; LEPR; LEPR_HUMAN; LEPRD; Leptin receptor; Leptin receptor fatty; Leptin receptor gene related protein; Leptin receptor precursor; Leptin receptor precursor; OB R gene related protein; OB receptor; OB-R; OB-RGRP; obl; Obr;
Immunogens
A synthesized peptide derived from human Leptin Receptor, corresponding to a region within C-terminal amino acids.
Isoform A is expressed in fetal liver and in hematopoietic tissues and choroid plexus. In adults highest expression in heart, liver, small intestine, prostate and ovary. Low level in lung and kidney. Isoform B is highly expressed in hypothalamus, but also in skeletal muscle. Detected in fundic and antral epithelial cells of the gastric mucosa (PubMed:19159218). Isoform B and isoform A are expressed by NK cells (at protein level) (PubMed:12504075).
- P48357 LEPR_HUMAN:
- Protein BLAST With
- NCBI/
- ExPASy/
- Uniprot
MICQKFCVVLLHWEFIYVITAFNLSYPITPWRFKLSCMPPNSTYDYFLLPAGLSKNTSNSNGHYETAVEPKFNSSGTHFSNLSKTTFHCCFRSEQDRNCSLCADNIEGKTFVSTVNSLVFQQIDANWNIQCWLKGDLKLFICYVESLFKNLFRNYNYKVHLLYVLPEVLEDSPLVPQKGSFQMVHCNCSVHECCECLVPVPTAKLNDTLLMCLKITSGGVIFQSPLMSVQPINMVKPDPPLGLHMEITDDGNLKISWSSPPLVPFPLQYQVKYSENSTTVIREADKIVSATSLLVDSILPGSSYEVQVRGKRLDGPGIWSDWSTPRVFTTQDVIYFPPKILTSVGSNVSFHCIYKKENKIVPSKEIVWWMNLAEKIPQSQYDVVSDHVSKVTFFNLNETKPRGKFTYDAVYCCNEHECHHRYAELYVIDVNINISCETDGYLTKMTCRWSTSTIQSLAESTLQLRYHRSSLYCSDIPSIHPISEPKDCYLQSDGFYECIFQPIFLLSGYTMWIRINHSLGSLDSPPTCVLPDSVVKPLPPSSVKAEITINIGLLKISWEKPVFPENNLQFQIRYGLSGKEVQWKMYEVYDAKSKSVSLPVPDLCAVYAVQVRCKRLDGLGYWSNWSNPAYTVVMDIKVPMRGPEFWRIINGDTMKKEKNVTLLWKPLMKNDSLCSVQRYVINHHTSCNGTWSEDVGNHTKFTFLWTEQAHTVTVLAINSIGASVANFNLTFSWPMSKVNIVQSLSAYPLNSSCVIVSWILSPSDYKLMYFIIEWKNLNEDGEIKWLRISSSVKKYYIHDHFIPIEKYQFSLYPIFMEGVGKPKIINSFTQDDIEKHQSDAGLYVIVPVIISSSILLLGTLLISHQRMKKLFWEDVPNPKNCSWAQGLNFQKPETFEHLFIKHTASVTCGPLLLEPETISEDISVDTSWKNKDEMMPTTVVSLLSTTDLEKGSVCISDQFNSVNFSEAEGTEVTYEDESQRQPFVKYATLISNSKPSETGEEQGLINSSVTKCFSSKNSPLKDSFSNSSWEIEAQAFFILSDQHPNIISPHLTFSEGLDELLKLEGNFPEENNDKKSIYYLGVTSIKKRESGVLLTDKSRVSCPFPAPCLFTDIRVLQDSCSHFVENNINLGTSSKKTFASYMPQFQTCSTQTHKIMENKMCDLTV
Predictions
Score>80(red) has high confidence and is suggested to be used for WB detection. *The prediction model is mainly based on the alignment of immunogen sequences, the results are for reference only, not as the basis of quality assurance.
High(score>80) Medium(80>score>50) Low(score<50) No confidence
Research Backgrounds
Receptor for hormone LEP/leptin (Probable). On ligand binding, mediates LEP central and peripheral effects through the activation of different signaling pathways such as JAK2/STAT3 and MAPK cascade/FOS. In the hypothalamus, LEP acts as an appetite-regulating factor that induces a decrease in food intake and an increase in energy consumption by inducing anorexinogenic factors and suppressing orexigenic neuropeptides, also regulates bone mass and secretion of hypothalamo-pituitary-adrenal hormones (By similarity). In the periphery, increases basal metabolism, influences reproductive function, regulates pancreatic beta-cell function and insulin secretion, is pro-angiogenic and affects innate and adaptive immunity. Control of energy homeostasis and melanocortin production (stimulation of POMC and full repression of AgRP transcription) is mediated by STAT3 signaling, whereas distinct signals regulate NPY and the control of fertility, growth and glucose homeostasis. Involved in the regulation of counter-regulatory response to hypoglycemia by inhibiting neurons of the parabrachial nucleus. Has a specific effect on T lymphocyte responses, differentially regulating the proliferation of naive and memory T -ells. Leptin increases Th1 and suppresses Th2 cytokine production (By similarity).
May transport LEP across the blood-brain barrier. Binds LEP and mediates LEP endocytosis. Does not induce phosphorylation of and activate STAT3.
Antagonizes Isoform A and isoform B-mediated LEP binding and endocytosis.
On ligand binding, phosphorylated on two conserved C-terminal tyrosine residues (isoform B only) by JAK2. Tyr-986 is required for complete binding and activation of PTPN11, ERK/FOS activation,for interaction with SOCS3 and SOCS3 mediated inhibition of leptin signaling. Phosphorylation on Tyr-1141 is required for STAT3 binding/activation. Phosphorylation of Tyr-1079 has a more accessory role.
Cell membrane>Single-pass type I membrane protein. Basolateral cell membrane.
Secreted.
Isoform A is expressed in fetal liver and in hematopoietic tissues and choroid plexus. In adults highest expression in heart, liver, small intestine, prostate and ovary. Low level in lung and kidney. Isoform B is highly expressed in hypothalamus, but also in skeletal muscle. Detected in fundic and antral epithelial cells of the gastric mucosa. Isoform B and isoform A are expressed by NK cells (at protein level).
The cytoplasmic domain may be essential for intracellular signal transduction by activation of JAK tyrosine kinase and STATs.
The WSXWS motif appears to be necessary for proper protein folding and thereby efficient intracellular transport and cell-surface receptor binding.
The box 1 motif is required for JAK interaction and/or activation.
Belongs to the type I cytokine receptor family. Type 2 subfamily.
Research Fields
· Environmental Information Processing > Signaling molecules and interaction > Cytokine-cytokine receptor interaction. (View pathway)
· Environmental Information Processing > Signaling molecules and interaction > Neuroactive ligand-receptor interaction.
· Environmental Information Processing > Signal transduction > AMPK signaling pathway. (View pathway)
· Environmental Information Processing > Signal transduction > Jak-STAT signaling pathway. (View pathway)
· Human Diseases > Endocrine and metabolic diseases > Non-alcoholic fatty liver disease (NAFLD).
· Organismal Systems > Endocrine system > Adipocytokine signaling pathway.
References

Application: WB Species: Mouse Sample:
Application: WB Species: Rat Sample:
Application: WB Species: Rat Sample:

Application: WB Species: Mouse Sample: hypothalamus

Application: IHC Species: Rat Sample:

Application: WB Species: Rat Sample: TSPCs
Application: IHC Species: Rat Sample:
Restrictive clause
Affinity Biosciences tests all products strictly. Citations are provided as a resource for additional applications that have not been validated by Affinity Biosciences. Please choose the appropriate format for each application and consult Materials and Methods sections for additional details about the use of any product in these publications.
For Research Use Only.
Not for use in diagnostic or therapeutic procedures. Not for resale. Not for distribution without written consent. Affinity Biosciences will not be held responsible for patent infringement or other violations that may occur with the use of our products. Affinity Biosciences, Affinity Biosciences Logo and all other trademarks are the property of Affinity Biosciences LTD.