


.
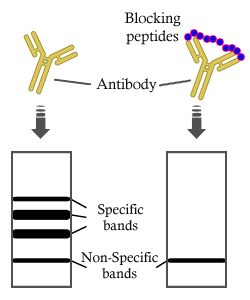
Bands result from membrane strip incubation.")


 and mouse anti-beta tubulin Ab(T0023 1:200) for 1 hour at 37°C. An AlexaFluor594 conjugated goat anti-rabbit IgG(H+L) Ab(Red) and an AlexaFluor488 conjugated goat anti-mouse IgG(H+L) Ab(Green) were used as the secondary antibody.
The nuclear counter stain is DAPI(blue).")
 The expression level of KLF4 and Drp1 in different time groups after treatment with H2O2")
 The ubiquitylation level of Drp1 in normal, MARCH5-siRNA and MARCH5-cDNA after treatment with H2O2.")
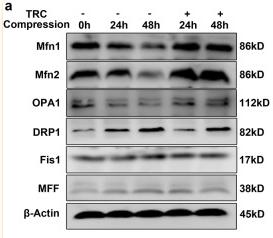
 The mitochondrial fission related protein expression extracted from cervical cancer cells. Drp1 expression was increased in both two cervical cancer cells. The mitochondrial fission related protein and gene expression level in cervical cancer cells were detected by western blotting and qPCR, respectively. Values (mean ± SDs) were obtained from at least three independent experiments.*P < 0.05, **P < 0.01, and ***P < 0.001 by one-way ANOVA with Tukey’s test.")
, TNF − α (20 ng/ml) + mangiferin (100 μM/ml), or TNF − α (20 ng/ml) + mangiferin (500 μM/ml). Total mRNA was extracted from each group, and the expression levels of (a) COX-2 and (b) iNOS were assayed using real-time PCR. Total protein was extracted from each group, and (c–e) the expression of COX-2 and iNOS was evaluated using Western blotting. (f–i) The expression levels of COX-2 and iNOS were detected using IF staining. Scale bar: 100 μm. All the experiments were repeated at least three times. Significant differences are indicated as follows: ∗P < 0.05, ∗∗P < 0.01, ∗∗∗P < 0.001, and ∗∗∗∗P < 0.0001.")
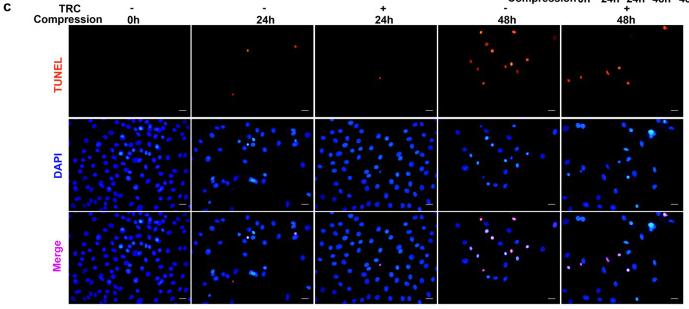
 Cardiomyocyte apoptosis determined by TUNEL staining. Scale bars = 25 μm. (B) Statistical analysis of TUNEL-positive cells (values are presented as mean ± SD, n = 6 per group). (C) Protein expression of Bax and Bcl-2 in mouse hearts at 14 days after MI. (D) Quantitative analysis of the relative Bcl-2/Bax ratio (n = 5 per group). (E) Macrophage infiltration determined by immunohistochemistry. Scale bars = 50 μm. (F) Statistical analysis of F4/80-positive cells (values are presented as mean ± SD, n = 6 per group). (G) IL1β mRNA expression (n = 6 per group). β-Actin was used as a loading control (values are presented as mean ± SD, n = 6 per group). (H) Quantitative analysis of the NADH oxidase activity level (values are presented as mean ± SD, n = 6 per group). (I) Quantitative analysis of the ATP level (values are presented as mean ± SD, n = 6 per group). (J) Quantitative analysis of the NAD+/NADH ratio (values are presented as mean ± SD, n = 5–6 per group). (K) Mitochondrial morphology was detected by TEM. Scale bars = 1 μm. (L) Quantitative analysis of the size of the mitochondria (values are presented as mean ± SD, n = 6 per group). (M) Quantitative analysis of the mitochondrial number/total area (values are presented as mean ± SD, n = 6 per group). (N) Protein expression of mitochondrial fusion proteins (MFN1 and MFN2) and mitochondrial fission proteins (p-Drp1Ser616, p-Drp1Ser616/Drp, Mid49, MFF, and Fis1) in mouse hearts at 14 days after MI (n = 5 per group). (O) Quantitative analysis of the relative MFN1 protein expression. Tubulin was used as a loading control. (P) Quantitative analysis of the relative MFN2 protein expression. Tubulin was used as a loading control. (Q) Quantitative analysis of the relative p-Drp1Ser616. Tubulin was used as a loading control. (R) Quantitative analysis of the relative p-Drp1Ser616/Drp. (S) Quantitative analysis of the relative Mid49 protein expression. Tubulin was used as a loading control. (T) Quantitative analysis of the relative MFF protein expression. Tubulin was used as a loading control. (U) Quantitative analysis of the relative Fis1 protein expression. Tubulin was used as a loading control. *p < 0.05 AAV9-NC-MI mice at 14 days after MI vs. AAV9-Sfrp5-MI mice at 14 days after MI. **p < 0.01 AAV9-NC-MI mice at 14 days after MI vs. AAV9-Sfrp5-MI mice at 14 days after MI. ***p < 0.001 AAV9-NC-MI mice at 14 days after MI vs. AAV9-Sfrp5-MI mice at 14 days after MI.")
 mediated the protective effect of mitochondrial function in H9c2 cells. (A) Protein levels of AMPK signaling. β-Tubulin was an internal reference control.")
 Changes in mitochondrial morphology of NPCs observed by IF staining of TOM-20 and represented by fluorescence photomicrograph (scale bar: 20 μm). (b, c) Representative western blot bands and quantitation of the expression of OPA1, Mfn1, Mfn2, DRP1, MFF, and Fis1. The data are represented as the mean ± SD from at least 3 independent experiments. ∗P < 0.05 and ∗∗P < 0.01 vs. the TBHP group.")
 Expression of IL-6, IL-1β, and TNF-α in the serum at 0 and 4 hours after CPB. Compared to the CPB group, C23 administration decreased the expression of IL-6, IL-1β, and TNF-α by 54.0%, 67.5%, and 45.2% at 4 hours, respectively. (g) Western blot analysis of renal Bax, Bcl-2, and cleaved-caspase-3 expression. (h) CPB upregulated the NADPH oxidase via the TLR-4/MyD88 pathway, which promoted the expressions of mitochondrial fission-related proteins Fis1 and Drp1 and reduced the expression of fusion-related protein Mfn2. ∗P < 0.05 vs. sham;")
 HEp-2 cells were infected with RSV (MOI = 2) (A and C) or transfected with a HA-NS1 plasmid for 36 h (B). The mitochondrial morphology (A and B) and mitochondrial membrane potential detected by JC-1 staining (C) were observed by TEM and fluorescence microscope, respectively. Scale bar = 2.5 µm (A)/2.0 µm (B). (D–G) HEp-2 cells were infected with GFP-RSV (MOI = 2) (D and F) or transfected with HA-NS1 plasmids for 36 h (E and G), and then stained with MitoTracker Red CMXRos (D) or MitoTracker Green (E), respectively. Nuclei were stained with Hoechst. The mitochondrial morphology and relative expression of proteins were observed by laser confocal microscopy and WB. Scale bar = 20 µm. (H–J) HEp-2, HEp-2-NC, and HEp-2-DRP1-KD cells were infected with RSV (H and J) or transfected with a Flag-NS1 plasmid for 36 h (I). Relative expression of proteins and viral titers were detected by WB and viral plaque assay, respectively. Each data represents the mean ± SD of three independent experiments.")
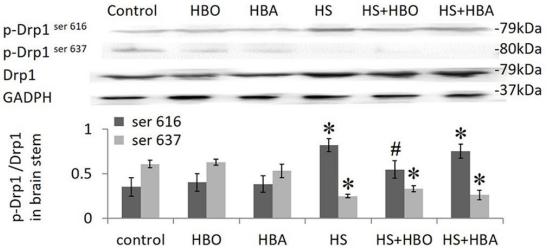
 The molecular structure of AB4. (B–D) Molecular docking of AB4 with GSK‐3β. The modelled 3D structure of GSK‐3β docked with AB4 (B). The enlarged view of binding site in box (C). The interaction bonds of GSK‐3β with AB4 (D). Bonds showed as yellow dotted lines, and bond lengths were presented as numbers. (E) The titration between AB4 and GSK‐3β. The top panel presents typical calorimetric titration of AB4 with GSK‐3β at 25°C. The bottom panel shows the plots of the heat evolved (kcal) per mol of AB4 added corrected for the heat of with GSK‐3β, against the molar ratio of AB4 to GSK‐3β. Data solid squares were fitted to a single set of the identical sites model, and the solid line represented the best fit. (F) Representative immunofluorescence staining images of GSK‐3β and Drp1 in the spinal dorsal horn of the control, CIA and CIA + AB4 groups. Scale bar = 20 μm. (G) Quantitative analysis of the fluorescence intensity of GSK‐3β and Drp1. (H, I) Western blot analysis and quantitative grey value analysis of pGSK‐3β‐Tyr216, GSK‐3β, pDrp1‐Ser616, pDrp1‐Ser637 and Drp1 level in the spinal cord of the control, CIA and CIA + AB4 groups. Data are presented as mean ± SD (n = 5). *p")
. B. After GPRASP2 deficiency, SGCs were extracted for RT-qPCR to verify the statistical map of mitochondrial quality control-related gene expression. C. WB was used to verify the protein levels of mitochondrial quality control proteins (DRP1, FIS1, MFN1, OPA1) in SGCs, and GAPDH was used as an internal reference. D-G. Quantitative analysis of mitochondrial quality control protein (DRP1, FIS1, MFN1, OPA1) protein levels by ImageJ. H. After GPRASP2 deficiency, SGCs were stained with Mito-Tracker Green, a mitochondrial-specific fluorescent probe. The mitochondria were labeled green, and the red box was a large part of the mitochondria (scale bar = 20 μm). I. The ATP content determination kit was used to determine the statistical energy map in SGCs after GPRASP2 deficiency. (n = 3; Data are presented as Mean ± SEM; *p < 0.05, **p < 0.01).")
, (b) Representative immunofluorescence staining images of Drp1 expressions in spinal dorsal horn (a) and quantitative fluorescence intensity analysis (b) of Drp1 in spinal dorsal horn. Scale bar = 20 μm. (c), (d) Western blot analysis (c) and quantification of the relative grey value (d) Drp1 and phosphorylated Drp1 at Ser616 and Ser637 level in spinal cord of control, CIA and CIA + Xn groups. (e) Representative TEM images of spinal mitochondria from control and CIA Mice. Scale bar = 200 nm. Data are presented as mean ± SD (n = 5 mice/group). *p < 0.05 versus control group, #p < 0.05 versus CIA group.")
 Effect of Biejiaxiaozheng pills on the mitochondrial membrane potential of RAW 264.7 cells. (B) Effect of Biejiaxiaozheng pills on the ATP contents of RAW 264.7 Cells. (C) Effect of Biejiaxiaozheng pills on the expression of DRP1 and OPA1 of RAW264.7 cells.")
 medicated serum improves mitochondrial function via mitochondrial homeostasis regulated by the OMA1-OPA1 pathway in LO2 cells. Western blotting was taken to determine the effect of NDD medicated serum on the expression of OMA1 and L-OPA1 (a); WB detection the interference potency of SiRNA-OPA1 (b); Western blotting was applied to examine the effect of NDD medicated serum on the expression of mitochondrial function-related proteins MFN1, MFN2, and DRP1 (c); The JC-1 kit was used to detect mitochondrial membrane potential (d); Kits were employed to measure reactive oxygen species levels (e). Data were presented as means ± standard error of mean.")
, RT-qPCR detection of miR-27b and Mff mRNA expression levels in each cell group. (C–F), Quantitative analysis of Mff, Drp1, Mid49, and Mid51 protein expression levels by Western blot. (G), Representative Western blot bands for each group. (H), Dual-luciferase reporter assay verifying the targeting relationship between miR-27b and Mff; upper panel shows wild-type (WT) and mutant-type (MT) Mff 3’UTR sequence diagrams. (I), Transmission electron microscopy observation of mitochondrial ultrastructure in each cell group, scale bar=500 nm. (J), Confocal laser scanning microscopy observation of MFF expression and subcellular localization in each cell group, scale bar=50 μm. #P")
, n = 3 per group. B Compared with the WT group, the mitochondrial count of mPFC neurons in the KO mice significantly decreased. C The mitochondrial circumference in the mPFC of KO mice was significantly greater than that of the WT. D Diagram of JC-1 flow cytometry results of primary neurons in the prefrontal cortex of mice, n = 5 per group. E Compared with the WT group, the decrease rate of mitochondrial membrane potential in the KO mice significantly increased. F Expression bands of mitochondrial dynamics related proteins, n = 5 per group. G, H Compared to the WT, the downregulation of p-Drp1 and Drp1 protein in the mPFC of KO mice. I–K The expression levels of MFN1, MFN2, and OPA1 proteins in the mPFC of KO mice remained unchanged compared to the WT. WT: wild-type mice; KO: TAAR1 knockout; MMP: mitochondrial membrane potential. Data are represented as mean ± SEM.")
 Effects of 10 μM Mdivi-1 stimulation for different durations on the protein expression of Drp1, Drp1 Ser616 and Drp1 Ser637 in KGN cells. (B) Effects of stimulation with different concentrations of Mdivi-1 on the protein expression of Drp1, Drp1 Ser616 and Drp1 Ser637 in KGN cells for 3 h. (C) Correlation between the expression of Drp1 Ser637 and Drp1 Ser616 in KGN cells and progesterone and estradiol synthesis. (D–E) mRNA expression levels of Drp1, Mfn1, Mfn2, and Opa1 in KGN cells and human luteinized GCs. (F–H) Immunofluorescence determination of the expression of Drp1, Drp1 Ser616 and Drp1 Ser637 in KGN cells. (I) Protein expression and phosphorylation of Drp1 in human luteinized GCs. (J–K) Protein expression of mitochondrial fusion proteins in KGN cells and human luteinized GCs (∗p < 0.05, ∗∗p < 0.005, ∗∗∗p < 0.001, ∗∗∗∗p < 0.0001).")
 Effects of 10 μM Mdivi-1 stimulation for different durations on the protein expression of Drp1, Drp1 Ser616 and Drp1 Ser637 in KGN cells. (B) Effects of stimulation with different concentrations of Mdivi-1 on the protein expression of Drp1, Drp1 Ser616 and Drp1 Ser637 in KGN cells for 3 h. (C) Correlation between the expression of Drp1 Ser637 and Drp1 Ser616 in KGN cells and progesterone and estradiol synthesis. (D–E) mRNA expression levels of Drp1, Mfn1, Mfn2, and Opa1 in KGN cells and human luteinized GCs. (F–H) Immunofluorescence determination of the expression of Drp1, Drp1 Ser616 and Drp1 Ser637 in KGN cells. (I) Protein expression and phosphorylation of Drp1 in human luteinized GCs. (J–K) Protein expression of mitochondrial fusion proteins in KGN cells and human luteinized GCs (∗p < 0.05, ∗∗p < 0.005, ∗∗∗p < 0.001, ∗∗∗∗p < 0.0001).")
| Product: | DRP1 Antibody |
| Catalog: | DF7037 |
| Description: | Rabbit polyclonal antibody to DRP1 |
| Application: | WB IHC IF/ICC |
| Cited expt.: | WB, IF/ICC |
| Reactivity: | Human, Mouse, Rat |
| Prediction: | Pig, Zebrafish, Bovine, Horse, Sheep, Rabbit, Dog, Chicken |
| Mol.Wt.: | 79kDa(Observed); 82kD(Calculated). |
| Uniprot: | O00429 |
| RRID: | AB_2838993 |
Control Products
Related Downloads
Protocols
Product Info
*The optimal dilutions should be determined by the end user. For optimal experimental results, antibody reuse is not recommended.
*Tips:
WB: For western blot detection of denatured protein samples. IHC: For immunohistochemical detection of paraffin sections (IHC-p) or frozen sections (IHC-f) of tissue samples. IF/ICC: For immunofluorescence detection of cell samples. ELISA(peptide): For ELISA detection of antigenic peptide.
Cite Format: Affinity Biosciences Cat# DF7037, RRID:AB_2838993.
Fold/Unfold
DLP1; dnm1l; DNM1L_HUMAN; Dnm1p/Vps1p-like protein; dnml1; DRP1; DVLP; Dymple; Dynamin 1 like; Dynamin family member proline-rich carboxyl-terminal domain less; Dynamin like protein; Dynamin related protein 1; Dynamin-1-like protein; Dynamin-like protein 4; Dynamin-like protein; Dynamin-like protein IV; Dynamin-related protein 1; DYNIV 11; EMPF; EMPF1; FLJ41912; HdynIV; VPS1;
Immunogens
A synthesized peptide derived from human DRP1, corresponding to a region within C-terminal amino acids.
Ubiquitously expressed with highest levels found in skeletal muscles, heart, kidney and brain. Isoform 1 is brain-specific. Isoform 2 and isoform 3 are predominantly expressed in testis and skeletal muscles respectively. Isoform 4 is weakly expressed in brain, heart and kidney. Isoform 5 is dominantly expressed in liver, heart and kidney. Isoform 6 is expressed in neurons.
- O00429 DNM1L_HUMAN:
- Protein BLAST With
- NCBI/
- ExPASy/
- Uniprot
MEALIPVINKLQDVFNTVGADIIQLPQIVVVGTQSSGKSSVLESLVGRDLLPRGTGIVTRRPLILQLVHVSQEDKRKTTGEENGVEAEEWGKFLHTKNKLYTDFDEIRQEIENETERISGNNKGVSPEPIHLKIFSPNVVNLTLVDLPGMTKVPVGDQPKDIELQIRELILRFISNPNSIILAVTAANTDMATSEALKISREVDPDGRRTLAVITKLDLMDAGTDAMDVLMGRVIPVKLGIIGVVNRSQLDINNKKSVTDSIRDEYAFLQKKYPSLANRNGTKYLARTLNRLLMHHIRDCLPELKTRINVLAAQYQSLLNSYGEPVDDKSATLLQLITKFATEYCNTIEGTAKYIETSELCGGARICYIFHETFGRTLESVDPLGGLNTIDILTAIRNATGPRPALFVPEVSFELLVKRQIKRLEEPSLRCVELVHEEMQRIIQHCSNYSTQELLRFPKLHDAIVEVVTCLLRKRLPVTNEMVHNLVAIELAYINTKHPDFADACGLMNNNIEEQRRNRLARELPSAVSRDKSSKVPSALAPASQEPSPAASAEADGKLIQDSRRETKNVASGGGGVGDGVQEPTTGNWRGMLKTSKAEELLAEEKSKPIPIMPASPQKGHAVNLLDVPVPVARKLSAREQRDCEVIERLIKSYFLIVRKNIQDSVPKAVMHFLVNHVKDTLQSELVGQLYKSSLLDDLLTESEDMAQRRKEAADMLKALQGASQIIAEIRETHLW
Predictions
Score>80(red) has high confidence and is suggested to be used for WB detection. *The prediction model is mainly based on the alignment of immunogen sequences, the results are for reference only, not as the basis of quality assurance.
High(score>80) Medium(80>score>50) Low(score<50) No confidence
Research Backgrounds
Functions in mitochondrial and peroxisomal division. Mediates membrane fission through oligomerization into membrane-associated tubular structures that wrap around the scission site to constrict and sever the mitochondrial membrane through a GTP hydrolysis-dependent mechanism. The specific recruitment at scission sites is mediated by membrane receptors like MFF, MIEF1 and MIEF2 for mitochondrial membranes. While the recruitment by the membrane receptors is GTP-dependent, the following hydrolysis of GTP induces the dissociation from the receptors and allows DNM1L filaments to curl into closed rings that are probably sufficient to sever a double membrane. Through its function in mitochondrial division, ensures the survival of at least some types of postmitotic neurons, including Purkinje cells, by suppressing oxidative damage. Required for normal brain development, including that of cerebellum. Facilitates developmentally regulated apoptosis during neural tube formation. Required for a normal rate of cytochrome c release and caspase activation during apoptosis; this requirement may depend upon the cell type and the physiological apoptotic cues. Plays an important role in mitochondrial fission during mitosis. Required for formation of endocytic vesicles. Proposed to regulate synaptic vesicle membrane dynamics through association with BCL2L1 isoform Bcl-X(L) which stimulates its GTPase activity in synaptic vesicles; the function may require its recruitment by MFF to clathrin-containing vesicles. Required for programmed necrosis execution. Rhythmic control of its activity following phosphorylation at Ser-637 is essential for the circadian control of mitochondrial ATP production.
Inhibits peroxisomal division when overexpressed.
Inhibits peroxisomal division when overexpressed.
Phosphorylation/dephosphorylation events on two sites near the GED domain regulate mitochondrial fission. Phosphorylation on Ser-637 inhibits the GTPase activity, leading to a defect in mitochondrial fission promoting mitochondrial elongation. Dephosphorylated on this site by PPP3CA which promotes mitochondrial fission. Phosphorylation on Ser-616 activates the GTPase activity and promotes mitochondrial fission. Phosphorylated in a circadian manner at Ser-637.
Sumoylated on various lysine residues within the B domain, probably by MUL1. Sumoylation positively regulates mitochondrial fission. Desumoylated by SENP5 during G2/M transition of mitosis. Appears to be linked to its catalytic activity.
S-nitrosylation increases DNM1L dimerization, mitochondrial fission and causes neuronal damage.
Ubiquitination by MARCHF5 affects mitochondrial morphology.
O-GlcNAcylation augments the level of the GTP-bound active form of DRP1 and induces translocation from the cytoplasm to mitochondria in cardiomyocytes. It also decreases phosphorylation at Ser-637 (By similarity).
Cytoplasm>Cytosol. Golgi apparatus. Endomembrane system>Peripheral membrane protein. Mitochondrion outer membrane>Peripheral membrane protein. Peroxisome. Membrane>Clathrin-coated pit. Cytoplasmic vesicle>Secretory vesicle>Synaptic vesicle membrane.
Note: Mainly cytosolic. Translocated to the mitochondrial membrane through O-GlcNAcylation and interaction with FIS1. Recruited to the mitochondrial outer membrane by interaction with MIEF1. Colocalized with MARCHF5 at mitochondrial membrane. Localizes to mitochondria at sites of division. Localizes to mitochondria following necrosis induction. Associated with peroxisomal membranes, partly recruited there by PEX11B. May also be associated with endoplasmic reticulum tubules and cytoplasmic vesicles and found to be perinuclear. In some cell types, localizes to the Golgi complex. Binds to phospholipid membranes.
Ubiquitously expressed with highest levels found in skeletal muscles, heart, kidney and brain. Isoform 1 is brain-specific. Isoform 2 and isoform 3 are predominantly expressed in testis and skeletal muscles respectively. Isoform 4 is weakly expressed in brain, heart and kidney. Isoform 5 is dominantly expressed in liver, heart and kidney. Isoform 6 is expressed in neurons.
The GED domain folds back to interact, in cis, with the GTP-binding domain and middle domain, and interacts, in trans, with the GED domains of other DNM1L molecules, and is thus critical for activating GTPase activity and for DNM1L dimerization.
Belongs to the TRAFAC class dynamin-like GTPase superfamily. Dynamin/Fzo/YdjA family.
Research Fields
· Cellular Processes > Cell growth and death > Necroptosis. (View pathway)
· Environmental Information Processing > Signal transduction > TNF signaling pathway. (View pathway)
· Organismal Systems > Immune system > NOD-like receptor signaling pathway. (View pathway)
References

Application: WB Species: Mouse Sample: MLE-12 cell
Application: IF/ICC Species: Rat Sample: NP cells
Application: WB Species: Rat Sample: NP cells

Application: WB Species: Mouse Sample: heart

Application: WB Species: Rat Sample: H9C2 cells
Application: WB Species: Human Sample:
Restrictive clause
Affinity Biosciences tests all products strictly. Citations are provided as a resource for additional applications that have not been validated by Affinity Biosciences. Please choose the appropriate format for each application and consult Materials and Methods sections for additional details about the use of any product in these publications.
For Research Use Only.
Not for use in diagnostic or therapeutic procedures. Not for resale. Not for distribution without written consent. Affinity Biosciences will not be held responsible for patent infringement or other violations that may occur with the use of our products. Affinity Biosciences, Affinity Biosciences Logo and all other trademarks are the property of Affinity Biosciences LTD.