, using ACP5 Antibody at 1/1000 dilution.
5ug/NC membrane strip.
Exposure for 12s with Affinity™ ECL Kit(#KF8001).
Bands result from membrane strip incubation.")
, using ACP5 Antibody at 1/1000 dilution.
5ug/NC membrane strip.
Exposure for 12s with Affinity™ ECL Kit(#KF8001).
Bands result from membrane strip incubation.")

 TRAP activity in the serum. (b) Expression levels of CTSK and ACP5 in the femoral heads. ∗∗p < 0.01; ns, no significant. TRAP, tartrate-resistant acid phosphatase; CTSK, cathepsin K; ACP5, acid phosphatase 5.")
 The (B) RNA and (C) protein levels of TRAP, c‐Fos, and NFATc1 in bone joint from mice of OVX group and sham group were checked by qPCR and western blotting assay. D The TRAP staining of bone joint from OVX mice and sham group. (E and F) The BMM and RAW264.7 cells were stimulated with RANKL, then (E) RNA and (F) protein levels of TRAP, c‐Fos, NFATc1, and KAT6A were measured by qPCR and western blotting assay. **p")
 Representative images of protein bands. (b-e) TGF-β1, (c) p-ERK1/2 / ERK1/2, (d) p-Smad2/Smad2, (e) pSmad3/Smad3, (f) type II collagen, (g) ALP, (h) TRACP, and (i) BMP7 were measured by western blot. (n=3, means ± SD) **P")
| Product: | ACP5 Antibody |
| Catalog: | DF6989 |
| Description: | Rabbit polyclonal antibody to ACP5 |
| Application: | WB IHC |
| Cited expt.: | WB |
| Reactivity: | Human, Mouse, Rat |
| Prediction: | Pig, Bovine, Horse, Sheep, Rabbit, Dog |
| Mol.Wt.: | 37kDa(Observed); 37kD(Calculated). |
| Uniprot: | P13686 |
| RRID: | AB_2838945 |
Control Products
Related Downloads
Protocols
Product Info
*The optimal dilutions should be determined by the end user. For optimal experimental results, antibody reuse is not recommended.
*Tips:
WB: For western blot detection of denatured protein samples. IHC: For immunohistochemical detection of paraffin sections (IHC-p) or frozen sections (IHC-f) of tissue samples. IF/ICC: For immunofluorescence detection of cell samples. ELISA(peptide): For ELISA detection of antigenic peptide.
Cite Format: Affinity Biosciences Cat# DF6989, RRID:AB_2838945.
Fold/Unfold
Type 5 acid phosphatase; Acid phosphatase 5 tartrate resistant; Acid phosphatase 5, tartrate resistant; ACP5; EC 3.1.3.2; MGC117378; PPA5_HUMAN; serum band 5 tartrate-resistant acid phosphatase; SPENCDI; T5ap; Tartrate resistant acid ATPase; Tartrate resistant acid phosphatase type 5; Tartrate resistant acid phosphatase type 5 precursor; Tartrate-resistant acid ATPase; Tartrate-resistant acid phosphatase type 5; TR AP; TR-AP; TRACP 5; TRAP; TrATPase; Type 5 acid phosphatase;
Immunogens
A synthesized peptide derived from human ACP5, corresponding to a region within N-terminal amino acids.
- P13686 PPA5_HUMAN:
- Protein BLAST With
- NCBI/
- ExPASy/
- Uniprot
MDMWTALLILQALLLPSLADGATPALRFVAVGDWGGVPNAPFHTAREMANAKEIARTVQILGADFILSLGDNFYFTGVQDINDKRFQETFEDVFSDRSLRKVPWYVLAGNHDHLGNVSAQIAYSKISKRWNFPSPFYRLHFKIPQTNVSVAIFMLDTVTLCGNSDDFLSQQPERPRDVKLARTQLSWLKKQLAAAREDYVLVAGHYPVWSIAEHGPTHCLVKQLRPLLATYGVTAYLCGHDHNLQYLQDENGVGYVLSGAGNFMDPSKRHQRKVPNGYLRFHYGTEDSLGGFAYVEISSKEMTVTYIEASGKSLFKTRLPRRARP
Predictions
Score>80(red) has high confidence and is suggested to be used for WB detection. *The prediction model is mainly based on the alignment of immunogen sequences, the results are for reference only, not as the basis of quality assurance.
High(score>80) Medium(80>score>50) Low(score<50) No confidence
Research Backgrounds
Involved in osteopontin/bone sialoprotein dephosphorylation. Its expression seems to increase in certain pathological states such as Gaucher and Hodgkin diseases, the hairy cell, the B-cell, and the T-cell leukemias.
Lysosome.
Belongs to the metallophosphoesterase superfamily. Purple acid phosphatase family.
Research Fields
· Cellular Processes > Transport and catabolism > Lysosome. (View pathway)
· Human Diseases > Immune diseases > Rheumatoid arthritis.
· Metabolism > Metabolism of cofactors and vitamins > Riboflavin metabolism.
· Metabolism > Global and overview maps > Metabolic pathways.
· Organismal Systems > Development > Osteoclast differentiation. (View pathway)
References

Application: WB Species: Mouse Sample:
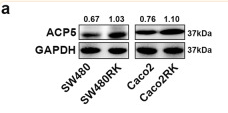
Application: WB Species: Human Sample: SW480 and Caco2 cells

Application: IF/ICC Species: Human Sample: SW480 and Caco2 cells

Application: WB Species: human Sample:

Application: WB Species: bovine Sample:

Application: WB Species: human Sample:

Application: WB Species: Sample: RAW264.7 cells
Restrictive clause
Affinity Biosciences tests all products strictly. Citations are provided as a resource for additional applications that have not been validated by Affinity Biosciences. Please choose the appropriate format for each application and consult Materials and Methods sections for additional details about the use of any product in these publications.
For Research Use Only.
Not for use in diagnostic or therapeutic procedures. Not for resale. Not for distribution without written consent. Affinity Biosciences will not be held responsible for patent infringement or other violations that may occur with the use of our products. Affinity Biosciences, Affinity Biosciences Logo and all other trademarks are the property of Affinity Biosciences LTD.