Product: Tryptophan Hydroxylase Antibody
Catalog: DF6465
Description: Rabbit polyclonal antibody to Tryptophan Hydroxylase
Application: WB IHC IF/ICC
Reactivity: Human, Mouse, Rat
Prediction: Bovine, Horse, Sheep, Rabbit, Chicken
Mol.Wt.: 55kDa; 51kD(Calculated).
Uniprot: P17752
RRID: AB_2838427

View similar products>>

   Size Price Inventory
 100ul $280 In stock
 200ul $350 In stock

Lead Time: Same day delivery

For pricing and ordering contact:
Local distributors

Product Info

Source:
Rabbit
Application:
WB 1:500-1:2000, IHC 1:50-1:200, IF/ICC 1:100-1:500
*The optimal dilutions should be determined by the end user.
*Tips:

WB: For western blot detection of denatured protein samples. IHC: For immunohistochemical detection of paraffin sections (IHC-p) or frozen sections (IHC-f) of tissue samples. IF/ICC: For immunofluorescence detection of cell samples. ELISA(peptide): For ELISA detection of antigenic peptide.

Reactivity:
Human,Mouse,Rat
Prediction:
Bovine(100%), Horse(100%), Sheep(100%), Rabbit(92%), Chicken(83%)
Clonality:
Polyclonal
Specificity:
Tryptophan Hydroxylase Antibody detects endogenous levels of total Tryptophan Hydroxylase.
RRID:
AB_2838427
Cite Format: Affinity Biosciences Cat# DF6465, RRID:AB_2838427.
Conjugate:
Unconjugated.
Purification:
The antiserum was purified by peptide affinity chromatography using SulfoLink™ Coupling Resin (Thermo Fisher Scientific).
Storage:
Rabbit IgG in phosphate buffered saline , pH 7.4, 150mM NaCl, 0.02% sodium azide and 50% glycerol. Store at -20 °C. Stable for 12 months from date of receipt.
Alias:

Fold/Unfold

Indoleacetic acid 5 hydroxylase; L tryptophan hydroxylase; MGC119994; TPH 1; TPH; TPH1; TPH1_HUMAN; TPRH; TRPH; Tryptophan 5 hydroxylase 1; Tryptophan 5 monooxygenase 1; Tryptophan 5 monooxygenase; Tryptophan 5-hydroxylase 1; Tryptophan 5-monooxygenase 1; Tryptophan hydroxylase 1;

Immunogens

Immunogen:
Uniprot:
Gene(ID):
Expression:
P17752 TPH1_HUMAN:

Isoform 2 seems to be less widely expressed than isoform 1.

Description:
Tryptophan hydroxylase (TPH) is the rate-limiting enzyme in the biosynthesis of serotonin (1) by converting tryptophan to 5-hydroxy-L-tryptophan (2). Two isoforms of TPH exist: TPH-1 is mainly expressed in the periphery, whereas the expression of TPH-2 is restricted to neuronal cells and the central nervous system (3). Most of the serotonin found throughout the body is synthesized by TPH-1 in enterochromaffin cells of the gastrointestinal tract. Targeted disruption of the tph1 gene results in low levels of circulating and tissue serotonin (4).
Sequence:
MIEDNKENKDHSLERGRASLIFSLKNEVGGLIKALKIFQEKHVNLLHIESRKSKRRNSEFEIFVDCDINREQLNDIFHLLKSHTNVLSVNLPDNFTLKEDGMETVPWFPKKISDLDHCANRVLMYGSELDADHPGFKDNVYRKRRKYFADLAMNYKHGDPIPKVEFTEEEIKTWGTVFQELNKLYPTHACREYLKNLPLLSKYCGYREDNIPQLEDVSNFLKERTGFSIRPVAGYLSPRDFLSGLAFRVFHCTQYVRHSSDPFYTPEPDTCHELLGHVPLLAEPSFAQFSQEIGLASLGASEEAVQKLATCYFFTVEFGLCKQDGQLRVFGAGLLSSISELKHALSGHAKVKPFDPKITCKQECLITTFQDVYFVSESFEDAKEKMREFTKTIKRPFGVKYNPYTRSIQILKDTKSITSAMNELQHDLDVVSDALAKVSRKPSI

Predictions

Predictions:

Score>80(red) has high confidence and is suggested to be used for WB detection. *The prediction model is mainly based on the alignment of immunogen sequences, the results are for reference only, not as the basis of quality assurance.

Species
Results
Score
Horse
100
Bovine
100
Sheep
100
Rabbit
92
Chicken
83
Pig
0
Dog
0
Xenopus
0
Zebrafish
0
Model Confidence:
High(score>80) Medium(80>score>50) Low(score<50) No confidence

PTMs - P17752 As Substrate

Site PTM Type Enzyme
K33 Acetylation
S58 Phosphorylation
T225 Phosphorylation
S228 Phosphorylation
S260 Phosphorylation
Y373 Phosphorylation
Y401 Phosphorylation
Y404 Phosphorylation

Research Backgrounds

Tissue Specificity:

Isoform 2 seems to be less widely expressed than isoform 1.

Subunit Structure:

Homotetramer.

Family&Domains:

Belongs to the biopterin-dependent aromatic amino acid hydroxylase family.

Research Fields

· Metabolism > Amino acid metabolism > Tryptophan metabolism.

· Metabolism > Metabolism of cofactors and vitamins > Folate biosynthesis.

· Metabolism > Global and overview maps > Metabolic pathways.

· Organismal Systems > Nervous system > Serotonergic synapse.

References

1). Overproduction of Gastrointestinal 5-HT Promotes Colitis-Associated Colorectal Cancer Progression via Enhancing NLRP3 Inflammasome Activation. Cancer Immunology Research, 2021 (PubMed: 34285037) [IF=10.1]

Application: WB    Species: Human    Sample: THP-1 cells

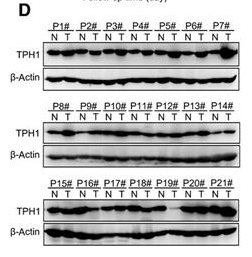
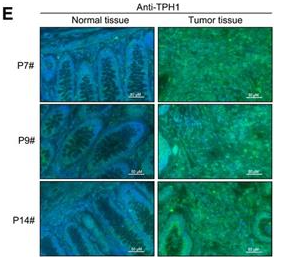
Figure 1.5-HT biosynthesis and secretion are upregulated in colorectal cancer cells. A, Kaplan–Meier overall survival curve of patients with colorectal cancer from TCGA based on expression of TPH1 in tumor tissues. Patients were divided into a TPH1-high expression group (n = 76) and a TPH1-low expression group (n = 304). B, mRNA expression of TPH1 in normal and tumor tissues of patients with colorectal cancer was detected by real-time PCR. C and D, Quantitative analysis of TPH1 protein expression and western blots in normal (N) and tumor (T) tissues of patients with colorectal cancer from B. B and C, Paired Student t test, n = 21. E, Representative immunofluorescence photos for TPH1 in normal and tumor tissues of colorectal cancer patients P7#, P9#, and P14#. F, mRNA expression of TPH1 in normal colorectal epithelial cell lines (FHS and FHC) and 153 colorectal cancer (CRC) cell lines from GEO database (GSE59857); unpaired t test. G, mRNA expression of TPH1 in the human normal colorectal epithelial cell line NCM460 and four human colorectal cancer cell lines (SW480, SW620, HCT116, and HT29), as well as THP-1. H, mRNA expression of Tph1 in mouse primary CECs and mouse colorectal cancer cell line CT26, as well as iBMDMs. I, Protein expression of TPH1 in NCM460, SW480, SW620, HCT116, HT29, and THP-1 cells, as well as CECs, CT26 cells, and iBMDMs. J and K, 5-HT concentrations in supernatants of NCM460, SW480, SW620, HCT116, HT29, and THP-1 cells, as well as CECs, CT26 cells, and iBMDMs detected by ELISA. G–K, Data represent mean ± SD for at least three independent experiments; one-way ANOVA; N.D., not detected. **, P < 0.01.

Application: IF/ICC    Species: Human    Sample: THP-1 cells

Figure 1.5-HT biosynthesis and secretion are upregulated in colorectal cancer cells. A, Kaplan–Meier overall survival curve of patients with colorectal cancer from TCGA based on expression of TPH1 in tumor tissues. Patients were divided into a TPH1-high expression group (n = 76) and a TPH1-low expression group (n = 304). B, mRNA expression of TPH1 in normal and tumor tissues of patients with colorectal cancer was detected by real-time PCR. C and D, Quantitative analysis of TPH1 protein expression and western blots in normal (N) and tumor (T) tissues of patients with colorectal cancer from B. B and C, Paired Student t test, n = 21. E, Representative immunofluorescence photos for TPH1 in normal and tumor tissues of colorectal cancer patients P7#, P9#, and P14#. F, mRNA expression of TPH1 in normal colorectal epithelial cell lines (FHS and FHC) and 153 colorectal cancer (CRC) cell lines from GEO database (GSE59857); unpaired t test. G, mRNA expression of TPH1 in the human normal colorectal epithelial cell line NCM460 and four human colorectal cancer cell lines (SW480, SW620, HCT116, and HT29), as well as THP-1. H, mRNA expression of Tph1 in mouse primary CECs and mouse colorectal cancer cell line CT26, as well as iBMDMs. I, Protein expression of TPH1 in NCM460, SW480, SW620, HCT116, HT29, and THP-1 cells, as well as CECs, CT26 cells, and iBMDMs. J and K, 5-HT concentrations in supernatants of NCM460, SW480, SW620, HCT116, HT29, and THP-1 cells, as well as CECs, CT26 cells, and iBMDMs detected by ELISA. G–K, Data represent mean ± SD for at least three independent experiments; one-way ANOVA; N.D., not detected. **, P < 0.01.

2). Multi-omics analysis of fecal microbiota transplantation's impact on functional constipation and comorbid depression and anxiety. BMC microbiology, 2023 (PubMed: 38057705) [IF=4.2]

Application: WB    Species: Human    Sample: QGP-1 cells

Fig. 5 Feces from patients with functional constipation and comorbid psychiatric symptoms increased 5-HT production. (A) QGP-1 cells treated with fecal supernatant (fecal supernatant: medium = 1:5) for various times, and cell viability was assessed by CCK-8. (B, C) Expression of TPH1 gene and protein as detected using qRT-PCR and WB assay. (D) The 5-HT of cell culture medium supernatant was detected by ELISA

Restrictive clause


Affinity Biosciences tests all products strictly. Citations are provided as a resource for additional applications that have not been validated by Affinity Biosciences. Please choose the appropriate format for each application and consult Materials and Methods sections for additional details about the use of any product in these publications.

For Research Use Only.
Not for use in diagnostic or therapeutic procedures. Not for resale. Not for distribution without written consent. Affinity Biosciences will not be held responsible for patent infringement or other violations that may occur with the use of our products. Affinity Biosciences, Affinity Biosciences Logo and all other trademarks are the property of Affinity Biosciences LTD.