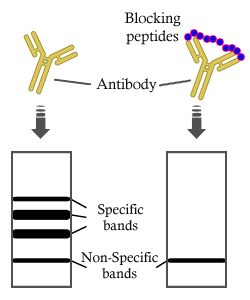
Product: FASN Antibody
Catalog: DF6106
Description: Rabbit polyclonal antibody to FASN
Application: WB IHC
Reactivity: Human, Mouse, Rat
Prediction: Zebrafish, Bovine, Horse, Dog
Mol.Wt.: 272kDa; 273kD(Calculated).
Uniprot: P49327
RRID: AB_2811172

View similar products>>

   Size Price Inventory
 100ul $280 In stock
 200ul $350 In stock

Lead Time: Same day delivery

For pricing and ordering contact:
Local distributors

Product Info

Source:
Rabbit
Application:
WB 1:500-1:2000, IHC 1:50-1:200
*The optimal dilutions should be determined by the end user.
*Tips:

WB: For western blot detection of denatured protein samples. IHC: For immunohistochemical detection of paraffin sections (IHC-p) or frozen sections (IHC-f) of tissue samples. IF/ICC: For immunofluorescence detection of cell samples. ELISA(peptide): For ELISA detection of antigenic peptide.

Reactivity:
Human,Mouse,Rat
Prediction:
Zebrafish(89%), Bovine(100%), Horse(100%), Dog(100%)
Clonality:
Polyclonal
Specificity:
FASN Antibody detects endogenous levels of total FASN.
RRID:
AB_2811172
Cite Format: Affinity Biosciences Cat# DF6106, RRID:AB_2811172.
Conjugate:
Unconjugated.
Purification:
The antiserum was purified by peptide affinity chromatography using SulfoLink™ Coupling Resin (Thermo Fisher Scientific).
Storage:
Rabbit IgG in phosphate buffered saline , pH 7.4, 150mM NaCl, 0.02% sodium azide and 50% glycerol. Store at -20 °C. Stable for 12 months from date of receipt.
Alias:

Fold/Unfold

[Acyl-carrier-protein] S acetyltransferase; [Acyl-carrier-protein] S malonyltransferase; 3-hydroxypalmitoyl-[acyl-carrier-protein] dehydratase; 3-oxoacyl-[acyl-carrier-protein] reductase; 3-oxoacyl-[acyl-carrier-protein] synthase; Enoyl-[acyl-carrier-protein] reductase; FAS; FAS_HUMAN; FASN; Fatty acid synthase; MGC14367; MGC15706; OA 519; Oleoyl-[acyl-carrier-protein] hydrolase; SDR27X1; Short chain dehydrogenase/reductase family 27X member 1;

Immunogens

Immunogen:
Uniprot:
Gene(ID):
Expression:
P49327 FAS_HUMAN:

Ubiquitous. Prominent expression in brain, lung, and liver.

Description:
Fatty acid synthase (FASN) catalyzes the synthesis of long-chain fatty acids from acetyl-CoA and malonyl-CoA. FASN is active as a homodimer with seven different catalytic activities and produces lipids in the liver for export to metabolically active tissues or storage in adipose tissue. In most other human tissues, FASN is minimally expressed since they rely on circulating fatty acids for new structural lipid synthesis (1).Recently, increased expression of FASN has emerged as a phenotype common to most human carcinomas. In breast cancer, immunohistochemical staining showed that the levels of FASN are directly related to the size of breast tumors (2). Studies also showed that FASN is highly expressed in lung and prostate cancers and that FASN expression is an indicator of poor prognosis in breast and prostate cancer (3-5). Furthermore, inhibition of FASN is selectively cytotoxic to human cancer cells (5). Thus, increased interest has focused on FASN as a potential target for the diagnosis and treatment of cancer as well as metabolic syndrome (6,7).
Sequence:
MEEVVIAGMSGKLPESENLQEFWDNLIGGVDMVTDDDRRWKAGLYGLPRRSGKLKDLSRFDASFFGVHPKQAHTMDPQLRLLLEVTYEAIVDGGINPDSLRGTHTGVWVGVSGSETSEALSRDPETLVGYSMVGCQRAMMANRLSFFFDFRGPSIALDTACSSSLMALQNAYQAIHSGQCPAAIVGGINVLLKPNTSVQFLRLGMLSPEGTCKAFDTAGNGYCRSEGVVAVLLTKKSLARRVYATILNAGTNTDGFKEQGVTFPSGDIQEQLIRSLYQSAGVAPESFEYIEAHGTGTKVGDPQELNGITRALCATRQEPLLIGSTKSNMGHPEPASGLAALAKVLLSLEHGLWAPNLHFHSPNPEIPALLDGRLQVVDQPLPVRGGNVGINSFGFGGSNVHIILRPNTQPPPAPAPHATLPRLLRASGRTPEAVQKLLEQGLRHSQDLAFLSMLNDIAAVPATAMPFRGYAVLGGERGGPEVQQVPAGERPLWFICSGMGTQWRGMGLSLMRLDRFRDSILRSDEAVKPFGLKVSQLLLSTDESTFDDIVHSFVSLTAIQIGLIDLLSCMGLRPDGIVGHSLGEVACGYADGCLSQEEAVLAAYWRGQCIKEAHLPPGAMAAVGLSWEECKQRCPPGVVPACHNSKDTVTISGPQAPVFEFVEQLRKEGVFAKEVRTGGMAFHSYFMEAIAPPLLQELKKVIREPKPRSARWLSTSIPEAQWHSSLARTSSAEYNVNNLVSPVLFQEALWHVPEHAVVLEIAPHALLQAVLKRGLKPSCTIIPLMKKDHRDNLEFFLAGIGRLHLSGIDANPNALFPPVEFPAPRGTPLISPLIKWDHSLAWDVPAAEDFPNGSGSPSAAIYNIDTSSESPDHYLVDHTLDGRVLFPATGYLSIVWKTLARALGLGVEQLPVVFEDVVLHQATILPKTGTVSLEVRLLEASRAFEVSENGNLVVSGKVYQWDDPDPRLFDHPESPTPNPTEPLFLAQAEVYKELRLRGYDYGPHFQGILEASLEGDSGRLLWKDNWVSFMDTMLQMSILGSAKHGLYLPTRVTAIHIDPATHRQKLYTLQDKAQVADVVVSRWLRVTVAGGVHISGLHTESAPRRQQEQQVPILEKFCFTPHTEEGCLSERAALQEELQLCKGLVQALQTKVTQQGLKMVVPGLDGAQIPRDPSQQELPRLLSAACRLQLNGNLQLELAQVLAQERPKLPEDPLLSGLLDSPALKACLDTAVENMPSLKMKVVEVLAGHGHLYSRIPGLLSPHPLLQLSYTATDRHPQALEAAQAELQQHDVAQGQWDPADPAPSALGSADLLVCNCAVAALGDPASALSNMVAALREGGFLLLHTLLRGHPLGDIVAFLTSTEPQYGQGILSQDAWESLFSRVSLRLVGLKKSFYGSTLFLCRRPTPQDSPIFLPVDDTSFRWVESLKGILADEDSSRPVWLKAINCATSGVVGLVNCLRREPGGNRLRCVLLSNLSSTSHVPEVDPGSAELQKVLQGDLVMNVYRDGAWGAFRHFLLEEDKPEEPTAHAFVSTLTRGDLSSIRWVCSSLRHAQPTCPGAQLCTVYYASLNFRDIMLATGKLSPDAIPGKWTSQDSLLGMEFSGRDASGKRVMGLVPAKGLATSVLLSPDFLWDVPSNWTLEEAASVPVVYSTAYYALVVRGRVRPGETLLIHSGSGGVGQAAIAIALSLGCRVFTTVGSAEKRAYLQARFPQLDSTSFANSRDTSFEQHVLWHTGGKGVDLVLNSLAEEKLQASVRCLATHGRFLEIGKFDLSQNHPLGMAIFLKNVTFHGVLLDAFFNESSADWREVWALVQAGIRDGVVRPLKCTVFHGAQVEDAFRYMAQGKHIGKVVVQVLAEEPEAVLKGAKPKLMSAISKTFCPAHKSYIIAGGLGGFGLELAQWLIQRGVQKLVLTSRSGIRTGYQAKQVRRWRRQGVQVQVSTSNISSLEGARGLIAEAAQLGPVGGVFNLAVVLRDGLLENQTPEFFQDVCKPKYSGTLNLDRVTREACPELDYFVVFSSVSCGRGNAGQSNYGFANSAMERICEKRRHEGLPGLAVQWGAIGDVGILVETMSTNDTIVSGTLPQRMASCLEVLDLFLNQPHMVLSSFVLAEKAAAYRDRDSQRDLVEAVAHILGIRDLAAVNLDSSLADLGLDSLMSVEVRQTLERELNLVLSVREVRQLTLRKLQELSSKADEASELACPTPKEDGLAQQQTQLNLRSLLVNPEGPTLMRLNSVQSSERPLFLVHPIEGSTTVFHSLASRLSIPTYGLQCTRAAPLDSIHSLAAYYIDCIRQVQPEGPYRVAGYSYGACVAFEMCSQLQAQQSPAPTHNSLFLFDGSPTYVLAYTQSYRAKLTPGCEAEAETEAICFFVQQFTDMEHNRVLEALLPLKGLEERVAAAVDLIIKSHQGLDRQELSFAARSFYYKLRAAEQYTPKAKYHGNVMLLRAKTGGAYGEDLGADYNLSQVCDGKVSVHVIEGDHRTLLEGSGLESIISIIHSSLAEPRVSVREG

Predictions

Predictions:

Score>80(red) has high confidence and is suggested to be used for WB detection. *The prediction model is mainly based on the alignment of immunogen sequences, the results are for reference only, not as the basis of quality assurance.

Species
Results
Score
Horse
100
Bovine
100
Dog
100
Zebrafish
89
Chicken
78
Pig
0
Sheep
0
Xenopus
0
Rabbit
0
Model Confidence:
High(score>80) Medium(80>score>50) Low(score<50) No confidence

PTMs - P49327 As Substrate

Site PTM Type Enzyme
M1 Acetylation
K12 Sumoylation
T34 Phosphorylation
K41 Ubiquitination
Y45 Phosphorylation
S63 Phosphorylation
K70 Acetylation
K70 Ubiquitination
S207 Phosphorylation
T211 Phosphorylation
C212 S-Nitrosylation
K213 Acetylation
K213 Ubiquitination
T217 Phosphorylation
Y222 Phosphorylation
S225 Phosphorylation
K235 Acetylation
K235 Ubiquitination
T245 Phosphorylation
T251 Phosphorylation
T253 Phosphorylation
K257 Acetylation
K257 Ubiquitination
S265 Phosphorylation
Y277 Phosphorylation
S279 Phosphorylation
S286 Phosphorylation
Y289 Phosphorylation
K298 Acetylation
K298 Ubiquitination
K326 Ubiquitination
S361 Phosphorylation
K436 Acetylation
K436 Ubiquitination
T463 Phosphorylation
Y470 Phosphorylation
S509 Phosphorylation
K528 Acetylation
K528 Ubiquitination
K611 Ubiquitination
K631 Acetylation
K631 Ubiquitination
C634 S-Nitrosylation
C642 S-Nitrosylation
K646 Acetylation
K646 Ubiquitination
K667 Ubiquitination
K673 Acetylation
K673 Ubiquitination
S724 Phosphorylation
S725 Phosphorylation
K772 Ubiquitination
K776 Acetylation
K776 Ubiquitination
K786 Acetylation
K787 Acetylation
K787 Ubiquitination
T827 Phosphorylation
S831 Phosphorylation
K897 Ubiquitination
T898 Phosphorylation
K927 Ubiquitination
T928 Phosphorylation
T930 Phosphorylation
S974 Phosphorylation
T976 Phosphorylation
T980 Phosphorylation
K992 Acetylation
K992 Ubiquitination
S1028 Phosphorylation
T1032 Phosphorylation
Y1047 Phosphorylation
K1065 Ubiquitination
Y1067 Phosphorylation
K1072 Acetylation
K1072 Ubiquitination
S1081 Phosphorylation
K1116 Acetylation
K1116 Ubiquitination
C1118 S-Nitrosylation
T1120 Phosphorylation
C1127 S-Nitrosylation
K1142 Ubiquitination
K1151 Acetylation
K1151 Ubiquitination
K1158 Ubiquitination
S1174 Phosphorylation
S1183 Phosphorylation
K1208 Ubiquitination
S1216 Phosphorylation
S1221 Phosphorylation
K1225 Ubiquitination
S1237 Phosphorylation
K1239 Acetylation
K1239 Ubiquitination
K1241 Ubiquitination
S1254 Phosphorylation
S1261 Phosphorylation
T1273 Phosphorylation
Y1367 Phosphorylation
S1373 Phosphorylation
S1379 Phosphorylation
S1382 Phosphorylation
K1393 Ubiquitination
T1407 Phosphorylation
S1411 Phosphorylation
S1421 Phosphorylation
K1429 Acetylation
K1429 Ubiquitination
K1444 Ubiquitination
C1471 S-Nitrosylation
S1479 Phosphorylation
Y1506 Phosphorylation
K1523 Acetylation
K1523 Ubiquitination
S1542 Phosphorylation
S1543 Phosphorylation
R1552 Methylation
K1582 Acetylation
K1582 Ubiquitination
S1584 Phosphorylation
K1591 Acetylation
K1591 Ubiquitination
T1593 Phosphorylation
S1594 Phosphorylation
S1597 Phosphorylation
S1701 Phosphorylation
K1704 Acetylation
K1704 Ubiquitination
S1723 Phosphorylation
K1739 Ubiquitination
S1747 Phosphorylation
K1752 Acetylation
K1752 Ubiquitination
K1771 Acetylation
K1827 Ubiquitination
K1847 Acetylation
K1847 Ubiquitination
K1851 Ubiquitination
K1866 Ubiquitination
K1869 Ubiquitination
K1871 Ubiquitination
S1874 Phosphorylation
S1877 Phosphorylation
K1878 Acetylation
K1878 Ubiquitination
K1911 Ubiquitination
K1927 Acetylation
K1927 Ubiquitination
S1947 Phosphorylation
S1948 Phosphorylation
K1993 Acetylation
K1993 Ubiquitination
K1995 Acetylation
K1995 Ubiquitination
S1997 Phosphorylation
T1999 Phosphorylation
R2004 Methylation
Y2034 Phosphorylation
R2043 Methylation
K2047 Ubiquitination
S2123 Phosphorylation
S2156 Phosphorylation
S2175 Phosphorylation
K2186 Ubiquitination
S2192 Phosphorylation
K2193 Ubiquitination
S2198 Phosphorylation
C2202 S-Nitrosylation
T2204 Phosphorylation
K2206 Acetylation
T2215 Phosphorylation
S2236 Phosphorylation
S2265 Phosphorylation
T2268 Phosphorylation
Y2269 Phosphorylation
T2356 Phosphorylation
K2391 Acetylation
K2391 Ubiquitination
K2406 Ubiquitination
R2413 Methylation
S2417 Phosphorylation
Y2424 Phosphorylation
Y2425 Phosphorylation
K2426 Acetylation
K2426 Ubiquitination
R2428 Methylation
Y2433 Phosphorylation
T2434 Phosphorylation
K2436 Acetylation
K2436 Ubiquitination
K2438 Acetylation
K2438 Ubiquitination
K2449 Sumoylation
K2449 Ubiquitination
K2471 Acetylation
K2471 Ubiquitination
T2483 Phosphorylation
S2488 Phosphorylation
S2499 Phosphorylation
S2507 Phosphorylation

Research Backgrounds

Function:

Fatty acid synthetase catalyzes the formation of long-chain fatty acids from acetyl-CoA, malonyl-CoA and NADPH. This multifunctional protein has 7 catalytic activities as an acyl carrier protein.

Subcellular Location:

Cytoplasm. Melanosome.
Note: Identified by mass spectrometry in melanosome fractions from stage I to stage IV.

Extracellular region or secreted Cytosol Plasma membrane Cytoskeleton Lysosome Endosome Peroxisome ER Golgi apparatus Nucleus Mitochondrion Manual annotation Automatic computational assertionSubcellular location
Tissue Specificity:

Ubiquitous. Prominent expression in brain, lung, and liver.

Subunit Structure:

Homodimer which is arranged in a head to tail fashion Ref.28). Interacts with CEACAM1; this interaction is insulin and phosphorylation-dependent; reduces fatty-acid synthase activity (By similarity).

Research Fields

· Environmental Information Processing > Signal transduction > AMPK signaling pathway.   (View pathway)

· Metabolism > Lipid metabolism > Fatty acid biosynthesis.

· Metabolism > Global and overview maps > Metabolic pathways.

· Metabolism > Global and overview maps > Fatty acid metabolism.

· Organismal Systems > Endocrine system > Insulin signaling pathway.   (View pathway)

References

1). β-patchoulene improves lipid metabolism to alleviate non-alcoholic fatty liver disease via activating AMPK signaling pathway. BIOMEDICINE & PHARMACOTHERAPY (PubMed: 33341045) [IF=7.5]

Application: WB    Species: Rat    Sample: hepatic tissue

Fig. 4. β-PAE inhibits the expression of hepatic lipid synthesis-related proteins and genes in HFD-fed rats. (A–F) Western blot analysis on the expression of proteins referred to hepatic lipid synthesis including SREBP-1c, ACC1, p-ACC1, FASN, SCD1 and HMG-CR; (G–H) The mRNA expression of SREBP-1c and HMG-CR. Data are presented as the mean ± SD (n = 6~8). ##p < 0.01 vs. NC group; *p < 0.05, **p < 0.01 vs. Model group.

2). Sirtuin 3‐mediated deacetylation of acyl‐CoA synthetase family member 3 by protocatechuic acid attenuates nonalcoholic fatty liver disease. British Journal of Pharmacology (PubMed: 32520409) [IF=7.3]

Application: WB    Species: Mouse    Sample: livers

Figure 3. PCA promotes fatty acid metabolism through SIRT3 activation. (A-E) Western blotting and real-time PCR analysis of hepatic FASN, SREBP-1c, CPT1, Acox1 and PPARα protein (n=5) and mRNA (n=6) levels in mouse livers. *P< 0.05 vs. the WT ND group, #P< 0.05 vs. the WT HFD group, &P< 0.05 vs. the SIRT3−/− ND group. (F-I) The protein expression of FASN, SREBP-1c, CPT1, Acox1, PPARα and SIRT3 was measured by Western blotting (n=5). The mRNA levels of (J) FASN, SREBP-1c (K) CPT1, Acox1 and PPARα were measured with real-time PCR (n=6). *P< 0.05 vs. the si-Control group, #P< 0.05 vs. the si-Control+PA group, &P< 0.05 vs. the si-Control+PA+PCA group.

3). FGF9 Alleviates the Fatty Liver Phenotype by Regulating Hepatic Lipid Metabolism. Frontiers in Pharmacology (PubMed: 35517790) [IF=5.6]

Application: WB    Species: mouse    Sample: liver

FIGURE 2 | Knockdown of FGF9 in the liver of DIO mice exacerbated fatty liver phenotype.. (H) Representative Western blotting analysis of genes involved in lipid synthesis in mice as described in (A).

4). Peptides released from bovine α-lactalbumin by simulated digestion alleviated free fatty acids-induced lipid accumulation in HepG2 cells. Journal of Functional Foods [IF=5.6]

5). Selegiline ameliorated dyslipidemia and hepatic steatosis in high-fat diet mice. International Immunopharmacology (PubMed: 36822098) [IF=5.6]

6). Methyl Brevifolincarboxylate Attenuates Free Fatty Acid-Induced Lipid Metabolism and Inflammation in Hepatocytes through AMPK/NF-κB Signaling Pathway. International Journal of Molecular Sciences (PubMed: 34576229) [IF=5.6]

Application: WB    Species: Human    Sample: SK-HEP-1 cells

Figure 3 Effect of methyl brevifolincarboxylate (MBC) on expression of lipogenesis and lipid oxidation mRNA and proteins in OA-treated SK-HEP-1 cells (A), and primary murine hepatocytes (B). Cells were treated with 0.5 mM of OA, and different concentrations of MBC (0, 20, 40, 60, and 80μM) for 48 h. Total RNA was isolated using a GENEzol reagent and mRNA was measured using qRT-PCR. Target gene mRNA levels were normalized to a reference gene β-actin. (C) Protein expression of FASN, ACC1, SREBP-1c, PPAR-α and (D) p-AMPK were detected by Western blot. All results are expressed as mean ± SD of three independent experiments. Data bars with similar letters were not significantly different (p ≤ 0.05).

7). Augmentation of 3β-hydroxysteroid-Δ24 Reductase (DHCR24) Expression Induced by Bovine Viral Diarrhea Virus Infection Facilitates Viral Replication via Promoting Cholesterol Synthesis. Journal of Virology (PubMed: 36468862) [IF=5.4]

Application: WB    Species: bovine    Sample: bovine cells

FIG 1 (A) Cholesterol synthesis pathway. (B) Heat map of the key genes (transcriptomic data) and corresponding proteins (proteomic data) involved in lipid metabolism in bovine viral diarrhea virus (BVDV)-infected bovine cells. (C, D) Identification of differentially expressed genes by quantitative reverse transcription-PCR (qRT-PCR) (C) and corresponding proteins by Western blotting (D). HMGCS1, 3- hydroxy-3-methylglutaryl-coenzyme A synthase 1; HMGCR, 3-hydroxy-3-methylglutaryl-coenzyme A reductase; MVK, mevalonate kinase; PMVK, phosphomevalonate kinase; MVD, diphosphomevalonate decarboxylase; FDPS, farnesyl diphosphate synthase; FDFT1, farnesyl diphosphate farnesyltransferase 1; SQLE, squalene epoxidase; GGPS, geranylgeranyl pyrophosphate synthase; LSS, lanosterol synthase; D8D7I, 3β-hydroxysterol-Δ8,7-isomerase; C5SD, 3β-hydroxysterol-C5 desaturase; DHCR7, 7-dehydrocholesterol reductase; DHCR24, 3β-hydroxysteroid-Δ24 reductase; SCD1, stearoyl-CoA desaturase; FASN, fatty acid synthase; ACACA, acetyl coenzyme A carboxylase alpha.

8). microRNA-378b regulates ethanol-induced hepatic steatosis by targeting CaMKK2 to mediate lipid metabolism. Bioengineered (PubMed: 34898362) [IF=4.9]

Application: WB    Species: Human    Sample: L-02 cells

Figure 3.miR-378b over-expression disturbs lipid metabolism in L-02 cells. (a) The TC level in L-02 cells. (b) The TG level in L-02 cells. (c) The expression level of miR-378b in L-02 cells. (d) mRNA expression levels of CaMKK2 in L-02 cells. (e) Western blot analysis for protein expression of CaMKK2 and p-AMPK/AMPK. (f) mRNA expression levels and protein expression levels for PPARα and CPT1. (g) mRNA expression levels and protein expression levels for FASN and SREBP1c. (h) Western blot analysis for protein expression of p-ACC/ACC. All data are expressed as the mean ± SD of at least three separate experiments. *p < 0.05, **p < 0.01 vs. control. #p < 0.05, ##p < 0.01 vs. miR-378b-mimics NC

Restrictive clause


Affinity Biosciences tests all products strictly. Citations are provided as a resource for additional applications that have not been validated by Affinity Biosciences. Please choose the appropriate format for each application and consult Materials and Methods sections for additional details about the use of any product in these publications.

For Research Use Only.
Not for use in diagnostic or therapeutic procedures. Not for resale. Not for distribution without written consent. Affinity Biosciences will not be held responsible for patent infringement or other violations that may occur with the use of our products. Affinity Biosciences, Affinity Biosciences Logo and all other trademarks are the property of Affinity Biosciences LTD.