


.
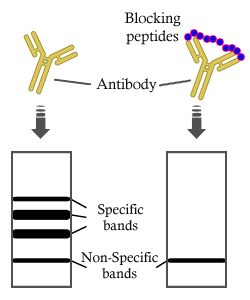
Bands result from membrane strip incubation.")


 Result of Western blot. (b) Relative expression level of protein.")
 Representative immunoblot of protein expression levels of S100, GFAP, NGRF, Sox10, EGR2 and GAPDH in control BMSCs, induced BMSCs, BMSCs + RSC96 exo, BMSCs + Fb exo or RSC96 cells. Data are presented as mean ± SD; *P<0.05, **P<0.01 and ***P<0.001. BMSCs, bone marrow mesenchymal stem cells; EGR2, early growth response 2; Fb exo, fibroblast‑derived exosomes; GFAP, glial fibrillary acidic protein; induced BMSCs, Dezawa's induction method; NGFR, low‑affinity nerve growth factor receptor; RSC96 exo, Schwann cell‑derived exosomes.")
. b–e The inflammatory marker proteins immunofluorescence staining and histograms at 14 days, including CD86, GFAP, TNF-α, iNOS(magnification × 400). All data presented as mean ± SEM in each group. *p < 0.05 vs. SCI + saline group, **p < 0.01 vs. SCI + saline group. #p < 0.05 comparison between SCI + EPO group and SCI + EPO + PD98059, ##p < 0.01 comparison between SCI + EPO group and SCI + EPO + PD98059")
(mean±SEM,N=
3).(A)ThebandsofROCK 2 ,GFAP,RhoA,andMBP.TherelativeexpressionofROCK 2 (B),GFAP(C),MBP(D),andRhoA(E)overcontrol.**P
<0.01vsKOShamgroup;
# P<0.05, ## P<0.01vsWTshamgroup; Δ P<0.05, ΔΔ P<0.01vsKOcerebralI/R; ▲ P<0.05, ▲▲ P<0.01vsWTcerebral
I/R.")
.(A)Immunostaining
forBrdU,GFAP,andcellsinthehippocampusofmiceat30daftercerebralI/R.Thearrowsindicatethepositivesignalsinsidecells.(B)Thenumbers
of BrdU/GFAP colabeled cells in the hippocampus. **P < 0.01 vs Sham group;
## P < 0.01 vs Cerebral I/R group. Scale bar = 50 μm.")
. (A) The expression of CTRP1 in neuron in the cortex, NeuN was used to label neuron. CTRP1 expression was observed by fluorescence microscope and is shown by green fluorescence. NeuN expression is shown by red fluorescence. The nuclei were stained with DAPI and is shown by blue fluorescence. (B) The expression of CTRP1 in astroglia in the cortex. GFAP was used to label astroglia. CTRP1 expression is shown by red fluorescence. GFAP expression is shown by green fluorescence. (C) The expression of CTRP1 in microglia in the cortex. IBA1 was used to label microglia. CTRP1 expression is shown by green fluorescence. IBA1 expression is shown by red fluorescence. (D) The intensity of CTRP1 and NeuN in the cortex. The representative images were acquired under × 400 magnification, scale bars = 50 μm. ****p < 0.0001 vs. sham group.")
. (A) The expression of CTRP1 in neuron in the cortex, NeuN was used to label neuron. CTRP1 expression was observed by fluorescence microscope and is shown by green fluorescence. NeuN expression is shown by red fluorescence. The nuclei were stained with DAPI and is shown by blue fluorescence. (B) The expression of CTRP1 in astroglia in the cortex. GFAP was used to label astroglia. CTRP1 expression is shown by red fluorescence. GFAP expression is shown by green fluorescence. (C) The expression of CTRP1 in microglia in the cortex. IBA1 was used to label microglia. CTRP1 expression is shown by green fluorescence. IBA1 expression is shown by red fluorescence. (D) The intensity of CTRP1 and NeuN in the cortex. The representative images were acquired under × 400 magnification, scale bars = 50 μm. ****p < 0.0001 vs. sham group.")

: (a) representative blots of GluN1, postsynaptic density protein 95 (PSD95), glial fibrillary acidic protein (GFAP), and glyceraldehyde‐3‐phosphate dehydrogenase (GAPDH); (b) the relative density of GluN1 normalized to GAPDH; (c) the relative density of PSD95; (d) the relative density of GFAP. a p < .05, compared to the groups of control (CON) and inflammatory pain (IP), b p < .05, different from all other groups, one‐way ANOVA with Tukey post hoc comparison. The data are expressed as the mean ± SEM, n = 3 per group.")
 Representative haematoxylin and eosin staining images (A) and quantitative analysis (B) of the spinal cord sections. Scale bar = 20 μm. (C) Representative immunofluorescence staining images of IL‐1β, GFAP, NLRP3, caspase‐1 and cleaved caspase‐1 in the spinal dorsal horn. Scale bar = 20 μm. (D) Quantitative analysis of the fluorescence intensity of IL‐1β, GFAP, NLRP3, caspase‐1 and cleaved caspase‐1. (E, F) Western blot analysis and quantitative grey value analysis of IL‐1β, GFAP, NLRP3, caspase‐1 and cleaved caspase‐1 levels in the spinal cord of the control, CIA and CIA + AB4 groups. Data are presented as mean ± SD (n = 5). *p")
 Immunofluorescence staining showing that p-STAT3 (red) co-localized with microglia (Iba1, green) and astrocytes (GFAP, green); (C–E) Expression levels of STAT3 and p-STAT3 in BV-2 cells were detected by Western blot assay. All data were derived from the results of three independent experiments. Values are mean ± SEM (n = 3 per group), ***P < 0.001, **P < 0.01, *P < 0.05 (one-way ANOVA followed by Tukey's post hoc test). DAPI: 4′,6-diamidino-2-phenylindole; GFAP: Glial fibrillary acidic protein; Iba1: Ionized calcium binding adapter molecule 1.")
 and (b) Representative H & E staining images (a) and quantitative analysis (b) of spinal cord sections. Scale bar = 20 μm. (c) and (d) Representative immunofluorescence staining images (c) and quantitative intensity analysis (d) of GFAP in spinal dorsal horn. Scale bar = 20 μm. (e) and (f) Representative immunofluorescence staining images (e) and quantitative intensity analysis (f) of IL-1β in spinal dorsal horn. Scale bar = 20 μm. (g) and (h) Western blot analysis (g) and quantitative grey value analysis (h) of GFAP and IL-1β levels in spinal cord of control, CIA and CIA + Xn groups. Data are presented as mean ± SD (n = 5 mice/group). *p < 0.05 versus control group, #p < 0.05 versus CIA group.")
 and (b) Representative H & E staining images (a) and quantitative analysis (b) of spinal cord sections. Scale bar = 20 μm. (c) and (d) Representative immunofluorescence staining images (c) and quantitative intensity analysis (d) of GFAP in spinal dorsal horn. Scale bar = 20 μm. (e) and (f) Representative immunofluorescence staining images (e) and quantitative intensity analysis (f) of IL-1β in spinal dorsal horn. Scale bar = 20 μm. (g) and (h) Western blot analysis (g) and quantitative grey value analysis (h) of GFAP and IL-1β levels in spinal cord of control, CIA and CIA + Xn groups. Data are presented as mean ± SD (n = 5 mice/group). *p < 0.05 versus control group, #p < 0.05 versus CIA group.")
 Immunofluorescence was employed to detect protein expression in rat brain tissue, followed by statistical analysis: (a) brain sections treated with DAPI (blue), PCNA (red), TH (green), Tuj-1 (orange), 7 and 14 days after AS-IV intervention, observed under a 10x microscope (scale bar = 100 μm); (b) staining of the brain sections with DAPI (blue), GFAP (green), caspase-3 (red) (scale bar = 100 μm), arrows represent caspase-3 protein fluorescence; (c) statistical comparison of fluorescence intensities of PCNA by the independent samples t test for PCNA; (d) fluorescence intensity of TH by independent samples t test; (e) fluorescence intensity of PCNA by independent samples t test; (f) fluorescence intensity of caspase-3 by independent samples t test; the data are expressed as mean ± SEM; n ≥ 3, ( ∗P < 0.05 vs. control group, ∗∗P < 0.005 vs. control group, #P < 0.05 vs. model group, ##P < 0.005 vs. model group, and ###P < 0.001 vs. model group).")
, b Heatmap generated by qRT-PCR analysis of RNA samples isolated from floating cells on 27 days, and monolayer mast cells on 45 and 60 days compared to control iPSCs (independent repeats = 2) c WB analysis for CD203c protein of mature mast cells on day 60 (independent repeats = 2), d IF staining of mast cells on days 30, 45, and 60 of culture with CD203c in the mast cell differentiation protocol (scale bars = 200 µm for ×40 magnification images, independent repeats = 3, Zeiss Axio Vert.A1). e Newly designed ICU patient-on-a-chip platform with differentiated mast cells, µ-platform matured cerebral organoids on day 60 and hCMEC/D3 populated membrane, for the BBB evaluation and cellular response in neural tissue recapitulating the response of a patient in the ICU to sedatives. f Brief characterization of µ-platform matured cerebral organoids with whole confocal imaging after tissue clearing, highlighted by FOXG1, SOX2, TUJ1, SATB2, CTIP2, PAX6, CD11b, GFAP, OLIG2, and DAPI stainings (scale bars = 200 μm for ×5, 50 μm for ×20 and 20 μm for ×40 magnification images, independent replicates = 3, Zeiss LSM 880).")
 The GFAP level was measured by immunocytochemistry (×400). The data are expressed as mean ± standard deviation, n = 6. **p")
. E Quantification of RAGE and p-NF-κB fluorescence intensity from D. F Quantification of GFAP- and Iba1-positive cell density from D. G ELISA of soluble IL-1β, IL-6, and TNF-α levels. Data are presented as mean ± SEM (n = 5 per group for PCR, IF, and WB; n = 6 per group for ELISA). Shapiro-Wilk and Bartlett’s tests were used to assess normality and variance homogeneity. All data were analyzed using one-way ANOVA with Tukey’s post hoc test. *P")
| Product: | GFAP Antibody |
| Catalog: | DF6040 |
| Description: | Rabbit polyclonal antibody to GFAP |
| Application: | WB IHC IF/ICC |
| Cited expt.: | WB, IHC, IF/ICC |
| Reactivity: | Human, Mouse, Rat |
| Prediction: | Bovine, Horse, Rabbit, Chicken |
| Mol.Wt.: | 45-50kDa(Observed); 50kD(Calculated). |
| Uniprot: | P14136 |
| RRID: | AB_2838012 |
Control Products
Related Downloads
Protocols
Product Info
*The optimal dilutions should be determined by the end user. For optimal experimental results, antibody reuse is not recommended.
*Tips:
WB: For western blot detection of denatured protein samples. IHC: For immunohistochemical detection of paraffin sections (IHC-p) or frozen sections (IHC-f) of tissue samples. IF/ICC: For immunofluorescence detection of cell samples. ELISA(peptide): For ELISA detection of antigenic peptide.
Cite Format: Affinity Biosciences Cat# DF6040, RRID:AB_2838012.
Fold/Unfold
wu:fb34h11; ALXDRD; cb345; etID36982.3; FLJ42474; FLJ45472; GFAP; GFAP_HUMAN; gfapl; Glial fibrillary acidic protein; Intermediate filament protein; wu:fk42c12; xx:af506734; zgc:110485;
Immunogens
A synthesized peptide derived from human GFAP, corresponding to a region within C-terminal amino acids.
- P14136 GFAP_HUMAN:
- Protein BLAST With
- NCBI/
- ExPASy/
- Uniprot
MERRRITSAARRSYVSSGEMMVGGLAPGRRLGPGTRLSLARMPPPLPTRVDFSLAGALNAGFKETRASERAEMMELNDRFASYIEKVRFLEQQNKALAAELNQLRAKEPTKLADVYQAELRELRLRLDQLTANSARLEVERDNLAQDLATVRQKLQDETNLRLEAENNLAAYRQEADEATLARLDLERKIESLEEEIRFLRKIHEEEVRELQEQLARQQVHVELDVAKPDLTAALKEIRTQYEAMASSNMHEAEEWYRSKFADLTDAAARNAELLRQAKHEANDYRRQLQSLTCDLESLRGTNESLERQMREQEERHVREAASYQEALARLEEEGQSLKDEMARHLQEYQDLLNVKLALDIEIATYRKLLEGEENRITIPVQTFSNLQIRETSLDTKSVSEGHLKRNIVVKTVEMRDGEVIKESKQEHKDVM
Predictions
Score>80(red) has high confidence and is suggested to be used for WB detection. *The prediction model is mainly based on the alignment of immunogen sequences, the results are for reference only, not as the basis of quality assurance.
High(score>80) Medium(80>score>50) Low(score<50) No confidence
Research Backgrounds
GFAP, a class-III intermediate filament, is a cell-specific marker that, during the development of the central nervous system, distinguishes astrocytes from other glial cells.
Phosphorylated by PKN1.
Cytoplasm.
Note: Associated with intermediate filaments.
Expressed in cells lacking fibronectin.
Belongs to the intermediate filament family.
Research Fields
· Environmental Information Processing > Signal transduction > Jak-STAT signaling pathway. (View pathway)
References

Application: WB Species: Mouse Sample:
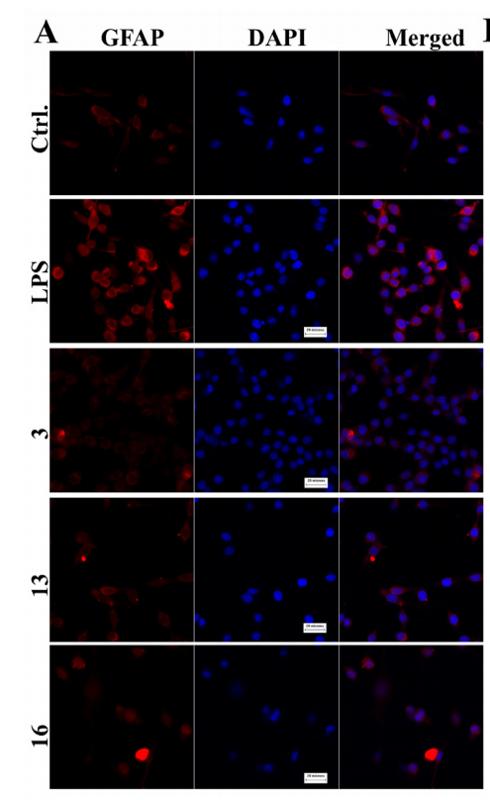
Application: IF/ICC Species: rat Sample: astrocytes

Application: IF/ICC Species: Mouse Sample:
Restrictive clause
Affinity Biosciences tests all products strictly. Citations are provided as a resource for additional applications that have not been validated by Affinity Biosciences. Please choose the appropriate format for each application and consult Materials and Methods sections for additional details about the use of any product in these publications.
For Research Use Only.
Not for use in diagnostic or therapeutic procedures. Not for resale. Not for distribution without written consent. Affinity Biosciences will not be held responsible for patent infringement or other violations that may occur with the use of our products. Affinity Biosciences, Affinity Biosciences Logo and all other trademarks are the property of Affinity Biosciences LTD.