Product: Calnexin Antibody
Catalog: AF5362
Description: Rabbit polyclonal antibody to Calnexin
Application: WB IHC IF/ICC
Reactivity: Human, Mouse, Rat, Monkey
Prediction: Pig, Zebrafish, Bovine, Horse, Sheep, Rabbit, Dog, Chicken, Xenopus
Mol.Wt.: 90 kDa; 68kD(Calculated).
Uniprot: P27824
RRID: AB_2837847

View similar products>>

   Size Price Inventory
 100ul $280 In stock
 200ul $350 In stock

Lead Time: Same day delivery

For pricing and ordering contact:
Local distributors

Product Info

Source:
Rabbit
Application:
WB 1:500-1:2000, IHC 1:50-1:200, IF/ICC 1:100-1:500
*The optimal dilutions should be determined by the end user.
*Tips:

WB: For western blot detection of denatured protein samples. IHC: For immunohistochemical detection of paraffin sections (IHC-p) or frozen sections (IHC-f) of tissue samples. IF/ICC: For immunofluorescence detection of cell samples. ELISA(peptide): For ELISA detection of antigenic peptide.

Reactivity:
Human,Mouse,Rat,Monkey
Prediction:
Pig(100%), Zebrafish(80%), Bovine(100%), Horse(100%), Sheep(100%), Rabbit(100%), Dog(100%), Chicken(80%), Xenopus(90%)
Clonality:
Polyclonal
Specificity:
Calnexin Antibody detects endogenous levels of total Calnexin.
RRID:
AB_2837847
Cite Format: Affinity Biosciences Cat# AF5362, RRID:AB_2837847.
Conjugate:
Unconjugated.
Purification:
The antiserum was purified by peptide affinity chromatography using SulfoLink™ Coupling Resin (Thermo Fisher Scientific).
Storage:
Rabbit IgG in phosphate buffered saline , pH 7.4, 150mM NaCl, 0.02% sodium azide and 50% glycerol. Store at -20 °C. Stable for 12 months from date of receipt.
Alias:

Fold/Unfold

Calnexin; CALX_HUMAN; CANX; CNX; FLJ26570; Histocompatibility complex class I antigen binding protein p88; IP90; Major histocompatibility complex class I antigen-binding protein p88; p90;

Immunogens

Immunogen:
Uniprot:
Gene(ID):
Description:
Calcium-binding protein that interacts with newly synthesized glycoproteins in the endoplasmic reticulum. It may act in assisting protein assembly and/or in the retention within the ER of unassembled protein subunits. It seems to play a major role in the quality control apparatus of the ER by the retention of incorrectly folded proteins.
Sequence:
MEGKWLLCMLLVLGTAIVEAHDGHDDDVIDIEDDLDDVIEEVEDSKPDTTAPPSSPKVTYKAPVPTGEVYFADSFDRGTLSGWILSKAKKDDTDDEIAKYDGKWEVEEMKESKLPGDKGLVLMSRAKHHAISAKLNKPFLFDTKPLIVQYEVNFQNGIECGGAYVKLLSKTPELNLDQFHDKTPYTIMFGPDKCGEDYKLHFIFRHKNPKTGIYEEKHAKRPDADLKTYFTDKKTHLYTLILNPDNSFEILVDQSVVNSGNLLNDMTPPVNPSREIEDPEDRKPEDWDERPKIPDPEAVKPDDWDEDAPAKIPDEEATKPEGWLDDEPEYVPDPDAEKPEDWDEDMDGEWEAPQIANPRCESAPGCGVWQRPVIDNPNYKGKWKPPMIDNPSYQGIWKPRKIPNPDFFEDLEPFRMTPFSAIGLELWSMTSDIFFDNFIICADRRIVDDWANDGWGLKKAADGAAEPGVVGQMIEAAEERPWLWVVYILTVALPVFLVILFCCSGKKQTSGMEYKKTDAPQPDVKEEEEEKEEEKDKGDEEEEGEEKLEEKQKSDAEEDGGTVSQEEEDRKPKAEEDEILNRSPRNRKPRRE

Predictions

Predictions:

Score>80(red) has high confidence and is suggested to be used for WB detection. *The prediction model is mainly based on the alignment of immunogen sequences, the results are for reference only, not as the basis of quality assurance.

Species
Results
Score
Pig
100
Horse
100
Bovine
100
Sheep
100
Dog
100
Rabbit
100
Xenopus
90
Zebrafish
80
Chicken
80
Model Confidence:
High(score>80) Medium(80>score>50) Low(score<50) No confidence

PTMs - P27824 As Substrate

Site PTM Type Enzyme
T59 O-Glycosylation
K61 Ubiquitination
T66 O-Glycosylation
Y70 Phosphorylation
S74 Phosphorylation
R77 Methylation
T79 O-Glycosylation
S81 Phosphorylation
S86 Phosphorylation
K87 Ubiquitination
T93 Phosphorylation
K99 Ubiquitination
K103 Acetylation
K103 Ubiquitination
K110 Ubiquitination
K118 Ubiquitination
R125 Methylation
K127 Ubiquitination
K134 Acetylation
K134 Ubiquitination
K137 Acetylation
K137 Ubiquitination
K170 Ubiquitination
K182 Ubiquitination
Y185 Phosphorylation
K193 Ubiquitination
K199 Acetylation
K199 Ubiquitination
K210 Ubiquitination
T211 Phosphorylation
Y214 Phosphorylation
K217 Acetylation
K217 Ubiquitination
K227 Acetylation
K227 Ubiquitination
T228 Phosphorylation
K233 Ubiquitination
R282 Methylation
K283 Ubiquitination
K300 Ubiquitination
S362 Phosphorylation
Y379 Phosphorylation
K380 Ubiquitination
Y393 Phosphorylation
K398 Ubiquitination
K401 Ubiquitination
S431 Phosphorylation
K458 Acetylation
K458 Ubiquitination
K459 Acetylation
K459 Ubiquitination
T509 Phosphorylation
S510 Phosphorylation
Y514 Phosphorylation
K516 Ubiquitination
K525 Ubiquitination
K537 Ubiquitination
K547 Ubiquitination
S554 Phosphorylation
T562 Phosphorylation
S564 Phosphorylation
S583 Phosphorylation P27361 (MAPK3) , P06493 (CDK1)

Research Backgrounds

Function:

Calcium-binding protein that interacts with newly synthesized glycoproteins in the endoplasmic reticulum. It may act in assisting protein assembly and/or in the retention within the ER of unassembled protein subunits. It seems to play a major role in the quality control apparatus of the ER by the retention of incorrectly folded proteins. Associated with partial T-cell antigen receptor complexes that escape the ER of immature thymocytes, it may function as a signaling complex regulating thymocyte maturation. Additionally it may play a role in receptor-mediated endocytosis at the synapse.

PTMs:

Phosphorylated at Ser-564 by MAPK3/ERK1. phosphorylation by MAPK3/ERK1 increases its association with ribosomes (By similarity).

Palmitoylation by DHHC6 leads to the preferential localization to the perinuclear rough ER. It mediates the association of calnexin with the ribosome-translocon complex (RTC) which is required for efficient folding of glycosylated proteins.

Ubiquitinated, leading to proteasomal degradation. Probably ubiquitinated by ZNRF4.

Subcellular Location:

Endoplasmic reticulum membrane>Single-pass type I membrane protein. Endoplasmic reticulum. Melanosome.
Note: Identified by mass spectrometry in melanosome fractions from stage I to stage IV (PubMed:12643545, PubMed:17081065). The palmitoylated form preferentially localizes to the perinuclear rough ER (PubMed:22314232).

Extracellular region or secreted Cytosol Plasma membrane Cytoskeleton Lysosome Endosome Peroxisome ER Golgi apparatus Nucleus Mitochondrion Manual annotation Automatic computational assertionSubcellular location
Subunit Structure:

Interacts with MAPK3/ERK1 (By similarity). Interacts with KCNH2. Associates with ribosomes (By similarity). Interacts with SGIP1; involved in negative regulation of endocytosis (By similarity). The palmitoylated form interacts with the ribosome-translocon complex component SSR1, promoting efficient folding of glycoproteins. Interacts with SERPINA2P/SERPINA2 and with the S and Z variants of SERPINA1. Interacts with PPIB. Interacts with ZNRF4. Interacts with SMIM22.

(Microbial infection) Interacts with HBV large envelope protein, isoform L.

(Microbial infection) Interacts with HBV large envelope protein, isoform M; this association may be essential for isoform M proper secretion.

Family&Domains:

Belongs to the calreticulin family.

Research Fields

· Cellular Processes > Transport and catabolism > Phagosome.   (View pathway)

· Genetic Information Processing > Folding, sorting and degradation > Protein processing in endoplasmic reticulum.   (View pathway)

· Human Diseases > Infectious diseases: Viral > HTLV-I infection.

· Organismal Systems > Immune system > Antigen processing and presentation.   (View pathway)

· Organismal Systems > Endocrine system > Thyroid hormone synthesis.

References

1). Circulating tumor cells shielded with extracellular vesicle-derived CD45 evade T cell attack to enable metastasis. Signal transduction and targeted therapy, 2024 (PubMed: 38575583) [IF=39.3]

Application: WB    Species: Human    Sample:

Fig. 3 CD45 shed from WBCs could be transferred via EVs to tumor cells. a GFP+ Caco2 cells co-cultured with Jurkat cells at a ratio of 1:4 for different time (0, 1, 2, 4, 8, 16 h), then GFP+ Caco2 cells were collected and stained with anti-CD45-APC to dynamically analyze the MFI shifting of CD45 among GFP+ Caco2 cells using flow cytometry. b Flow cytometric analysis of CD45 transfer from Jurkat cells to Caco2 cells, or from Jurkat cells/ THP1 cells/ WBCs to DLD1 cells following 16 h of indirect co-culture. c, d Bar graph showing the MFI of CD45-PE of Caco2 cells or DLD1 cells after 16 h of indirect co-culture with Jurkat cells/ THP1 cells/ WBCs. e, f Immunoblot analysis showing the makers of EVs isolated from supernatant of THP1 and Jurkat cells. e Density gradient fractions of EVs from Jurkat cells. f Positive (TSG101 and CD63) and negative (Calnexin) markers of EVs. WCL: whole cell lysis. Each ladder was loaded with protein 30 μg. g Nanoparticle tracking analysis of Jurkat cell-derived EVs. h Transmission electron microscope imaging of Jurkat cell-derived EVs. Scale bar = 50 nm. i Plasma EVs charactering by immunoblotting. Jurkat-EVs was used as positive control. P1- and P2-EVs were examples of two CRC cancer patients, HD1 and HD2 were examples of two healthy donors. j Plasma EVs charactering by nano-flow cytometry analysis. k, l CD45 ELISA assay for the measurement of EVs-derived CD45 from healthy donors (HD) and CRC patients (PD) with or without metastasis. m Time series of live cell imaging of DLD1-RFP cells after the addition of EVs (20 μg/mL) derived from CD45-GFP-expressing HEK293T cells for up to 8 h. Scale bar = 5 μm. n Immunofluorescence images of GFP+ Caco2 cells after incubation with PBS or EVs isolated from Jurkat cell supernatant for 12 h. Left scale bar = 20 μm, right scale bar = 5 μm. o Flow cytometric analysis for the measurement of Jurkat cell-derived EVs uptake by Caco2 cells. Caco2 cells were incubated with different concentration of PKH26-stained EVs (0, 1, 2, or 4 μg/mL) for 12 h before analysis. p Caco2 cells were incubated with PKH26-stained EVs (2 μg/mL) and chlorpromazine (CPZ, 0, 5, 10, or 20 μg/mL) for 12 h before collection for flow cytometric analysis of PKH26+ Caco2 cells. All bar graph data are presented as means ± SEM. *P 

2). Reversible Deformation of Artificial Cell Colonies Triggered by Actin Polymerization for Muscle Behavior Mimicry. Advanced materials (Deerfield Beach, Fla.), 2022 (PubMed: 35765153) [IF=29.4]

3). Large-scale generation of functional mRNA-encapsulating exosomes via cellular nanoporation. Nature Biomedical Engineering, 2019 (PubMed: 31844155) [IF=28.1]

Application: WB    Species: Mice    Sample: Tumour cells

Fig. 5 | CNP increases exosome release through HSP–p53–TASP6 signalling pathway. a, Simulated temperature changes at five selected locations. A 200 V and 10 ms pulse created a localized ‘hot spot’ in the nanochannel outlet with a power density of ~1 × 1014 W m−3 and a peak temperature up to 60 °C from room temperature. Once the pulse ended, the hot spot vanished rapidly due to the extremely small volume of the heated fluid inside the nanochannel (~1 × 10−12 cm3 ) compared with the bulk solution outside the nanochannel (~0.1 cm3 ). b, Top-down images of MEFs (green) attaching to the surface of the CNP device. Red dots show nanochannel locations and room temperature before CNP transfection (0 s). White arrows indicate locations of the nanochannels. The CNP electric pulse (CNP) sharply increases temperature at the nanochannel–cell surface interface. c, Cross-section view of nanochannels shows temperature changes in the nanochannels before (0 s), during and after (1 s) a CNP pulse. d, Temperature at the cell–nanochannel interface transiently (<1 s) increases to ~60 °C. e, Western blot of HSP90 and HSP70 from untreated (PBS) and CNP (with PBS)-stimulated (CNP) MEFs. f, DLS measurements of exosome concentrations from 108 CNP-stimulated MEFs with or without HSP inhibitors show that HSP70 and HSP90 are critical for the production of exosomes. NVP-HSP990, HSP90 inhibitor; VER155008, HSP70 inhibitor. g, Western blots show that CNP increases expression of p53 and TSAP6 protein in p53 wild-type MEFs, but does not affect p53 or TSAP6 protein expression in p53−/− MEFs. h, DLS measurements of exosome concentrations show that knockdown of p53 can partially block exosome release after CNP. i, Schematic of a proposed mechanism for CNP triggering of exosome release in CNP-transfected cells. Data are from three independent experiments and are presented as mean ± s.e.m. Two-sided Student’s t-test was used for the comparison.

4). Mitochondrial DNA-boosted dendritic cell-based nanovaccination triggers antitumor immunity in lung and pancreatic cancers. Cell reports. Medicine, 2024 (PubMed: 38986624) [IF=14.3]

Application: WB    Species: Human    Sample:

Figure 2 Creation and characterization of cNPcancer cell@MVDC (A) Schematic diagram illustrating the production of cNPorganoid@MVhDC. (B) TEM analysis of cNPs before and after adsorbing PDAC patient-derived tumor organoid lysate, with curve charts showing the size changes. Results shown are representative of three independent experiments. (C) SEM analysis of human or mouse immature DC morphology after indicated treatments. White arrows indicate MV budding. (D) TEM analysis of cNPorganoid@MVhDC and cNPDT6066@MVDC, including representative images and magnified views. White dot lines represent MV’s membrane thickness. (E) Confocal microscopy examination of red PKH26 membrane fluorescent dye stained cNPorganoid@MVhDC or cNPDT6066@MVDC derived from UV-stimulated human/mouse DCs pulsed with green PKH67 fluorescently labeled cNPorganoid or cNPDT6066. Representative IF images of three independent experiments are given. (F) Curve charts show the size of cNPorganoid@MVhDC (top) and cNPDT6066@MVDC (bottom), respectively. Results shown are representative of three independent experiments. (G and H) Venn diagram analysis comparing proteomics data between different indicated groups (n = 3 independent samples). (I and J) Heatmap analysis of the proteomics data in (G) and (H). (K and L) Western blot analysis of the indicated proteins in each group. TSG101 was used as a loading control (n = 3 independent experiments). (M and N) Flow cytometry analysis of CD86, MHC-I, or MHC-II expression in each group. Results shown are representative of three independent experiments. Scale bars in (B) represent 200 nm. (C) 5 μm. (D) 0.5μm (top), 200 nm (middle), 50 nm (bottom). (E) 100 μm. See also Figure S2.

5). Isothiazolinone dysregulates the pattern of miRNA secretion: Endocrine implications for neurogenesis. Environment international, 2023 (PubMed: 37939439) [IF=11.8]

6). Small extracellular vesicles encapsulating lefty1 mRNA inhibit hepatic fibrosis. Asian Journal of Pharmaceutical Sciences, 2022 (PubMed: 36382306) [IF=10.2]

7). OSCC cell-secreted exosomal CMTM6 induced M2-like macrophages polarization via ERK1/2 signaling pathway. Cancer immunology, immunotherapy : CII, 2021 (PubMed: 33104837) [IF=5.8]

Application: WB    Species: Mice    Sample: M0 cells

Fig. 4 The isolation and identifcation of Cal-27 exosomes. a A sketch of isolation path and identifcation of exosomes. b Western blot analyzed of exosomes for CD63, CD9 and CD81 (exosome biomarker), Calnexin (negative marker) and CMTM6. c Western blot analyzed of M0 cells and exosomes incubated M0 cells for CMTM6. d Representative fuorescent images for PKH26-labeled exosomes taken by M0 after 12 h incubation. Exosomes were stained red and M0 nuclei were stained blue by DAPI (scale bar: 25um). Cal-27 cells incubated with non-labeled exosomes (PBS was added to 25 μg exosomes instead of PKH26) and Cal-27 cells with only PKH26 (PKH26 was added to PBS and was re-isolated as stated) were used as controls

8). Endothelial Dysfunction, Inflammation and Coronary Artery Disease: Potential Biomarkers and Promising Therapeutical Approaches. INTERNATIONAL JOURNAL OF MOLECULAR SCIENCES, 2021 (PubMed: 33917744) [IF=5.6]

9). Exosomes derived from smooth muscle cells ameliorate diabetes‐induced erectile dysfunction by inhibiting fibrosis and modulating the NO/cGMP pathway. Journal of Cellular and Molecular Medicine, 2020 (PubMed: 33009701) [IF=5.3]

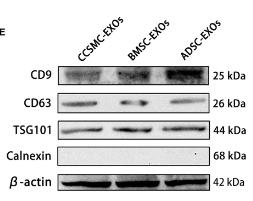
Application: WB    Species: Rat    Sample: CCSMCs

FIGURE 1Cell identification and exosome characterization. (A) Representative flow cytometry histograms of BMSCs and ADSCs show positive staining for CD29 and CD90 but not for CD34 and CD45. (B) BMSCs and ADSCs were successfully induced into osteoblasts (positively stained with Alizarin Red S) and adipocytes (positively stained with Oil Red O). The magnification is 100×. (C) Representative immunofluorescence results of CCSMCs show positive expression for α-SMA and desmin. Scale bars = 50 μm. (D) Exosomes derived from CCSMCs, BMSCs and ADSCs were observed using transmission electron microscopy, and the particle size distributions of the exosomes were measured by nanoparticle tracking analysis. Scale bars = 100 nm. (E) Representative results of Western blot analysis of exosomes derived from CCSMCs, BMSCs and ADSCs show positive expression for CD9, CD63 and TSG101 but not for calnexin. CCSMC: corpus cavernosum smooth muscle cell; BMSC: bone marrow stem cell; ADSC: adipose-derived stem cell; CCSMC-EXOs: exosomes derived from corpus cavernosum smooth muscle cells; BMSC-EXOs: exosomes derived from bone marrow stem cells; ADSC-EXOs: exosomes derived from adipose-derived stem cells; α-SMA: α-smooth muscle actin; DAPI: 4’,6-diamidino-2-phenylindole

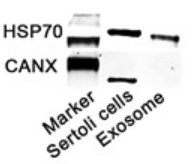
10). Seminal exosomal miR‐210‐3p as a potential marker of Sertoli cell damage in Varicocele. Andrology, 2021 (PubMed: 33000559) [IF=4.5]

Load more

Restrictive clause


Affinity Biosciences tests all products strictly. Citations are provided as a resource for additional applications that have not been validated by Affinity Biosciences. Please choose the appropriate format for each application and consult Materials and Methods sections for additional details about the use of any product in these publications.

For Research Use Only.
Not for use in diagnostic or therapeutic procedures. Not for resale. Not for distribution without written consent. Affinity Biosciences will not be held responsible for patent infringement or other violations that may occur with the use of our products. Affinity Biosciences, Affinity Biosciences Logo and all other trademarks are the property of Affinity Biosciences LTD.