Product: RPL34 Antibody
Catalog: DF3708
Description: Rabbit polyclonal antibody to RPL34
Application: WB IHC IF/ICC
Reactivity: Human, Mouse, Rat, Monkey
Prediction: Pig, Zebrafish, Bovine, Horse, Sheep, Chicken, Xenopus
Mol.Wt.: 13 KD; 13kD(Calculated).
Uniprot: P49207
RRID: AB_2836072

View similar products>>

   Size Price Inventory
 100ul $280 In stock
 200ul $350 In stock

Lead Time: Same day delivery

For pricing and ordering contact:
Local distributors

Product Info

Source:
Rabbit
Application:
WB 1:500-1:1000, IF/ICC 1:100-1:500, IHC 1:50-1:200
*The optimal dilutions should be determined by the end user.
*Tips:

WB: For western blot detection of denatured protein samples. IHC: For immunohistochemical detection of paraffin sections (IHC-p) or frozen sections (IHC-f) of tissue samples. IF/ICC: For immunofluorescence detection of cell samples. ELISA(peptide): For ELISA detection of antigenic peptide.

Reactivity:
Human,Mouse,Rat,Monkey
Prediction:
Pig(100%), Zebrafish(100%), Bovine(100%), Horse(100%), Sheep(100%), Chicken(100%), Xenopus(100%)
Clonality:
Polyclonal
Specificity:
RPL34 Antibody detects endogenous levels of total RPL34.
RRID:
AB_2836072
Cite Format: Affinity Biosciences Cat# DF3708, RRID:AB_2836072.
Conjugate:
Unconjugated.
Purification:
The antiserum was purified by peptide affinity chromatography using SulfoLink™ Coupling Resin (Thermo Fisher Scientific).
Storage:
Rabbit IgG in phosphate buffered saline , pH 7.4, 150mM NaCl, 0.02% sodium azide and 50% glycerol. Store at -20 °C. Stable for 12 months from date of receipt.
Alias:

Fold/Unfold

60S ribosomal protein L34; L34; MGC111005; Ribosomal protein L34;

Immunogens

Immunogen:

A synthesized peptide derived from human RPL34, corresponding to a region within C-terminal amino acids.

Uniprot:
Gene(ID):
Sequence:
MVQRLTYRRRLSYNTASNKTRLSRTPGNRIVYLYTKKVGKAPKSACGVCPGRLRGVRAVRPKVLMRLSKTKKHVSRAYGGSMCAKCVRDRIKRAFLIEEQKIVVKVLKAQAQSQKAK

Predictions

Predictions:

Score>80(red) has high confidence and is suggested to be used for WB detection. *The prediction model is mainly based on the alignment of immunogen sequences, the results are for reference only, not as the basis of quality assurance.

Species
Results
Score
Pig
100
Horse
100
Bovine
100
Sheep
100
Xenopus
100
Zebrafish
100
Chicken
100
Dog
0
Rabbit
0
Model Confidence:
High(score>80) Medium(80>score>50) Low(score<50) No confidence

PTMs - P49207 As Substrate

Site PTM Type Enzyme
R10 Methylation
S12 Phosphorylation
Y13 Phosphorylation
T15 Phosphorylation
S17 Phosphorylation
K19 Ubiquitination
R29 Methylation
Y32 Phosphorylation
K36 Acetylation
K36 Ubiquitination
K37 Acetylation
K43 Ubiquitination
K62 Ubiquitination
T70 Phosphorylation
R76 Methylation
K85 Ubiquitination
R88 Methylation
K101 Ubiquitination
K105 Ubiquitination
K108 Ubiquitination
K115 Acetylation
K115 Ubiquitination

Research Backgrounds

Function:

Component of the large ribosomal subunit.

Subcellular Location:

Cytoplasm>Cytosol. Cytoplasm. Endoplasmic reticulum.
Note: Detected on cytosolic polysomes (PubMed:25957688). Detected in ribosomes that are associated with the rough endoplasmic reticulum (By similarity).

Extracellular region or secreted Cytosol Plasma membrane Cytoskeleton Lysosome Endosome Peroxisome ER Golgi apparatus Nucleus Mitochondrion Manual annotation Automatic computational assertionSubcellular location
Subunit Structure:

Component of the large ribosomal subunit.

Family&Domains:

Belongs to the eukaryotic ribosomal protein eL34 family.

References

1). Dual Inhibition of DKC1 and MEK1/2 Synergistically Restrains the Growth of Colorectal Cancer Cells. Advanced Science (PubMed: 34026451) [IF=15.1]

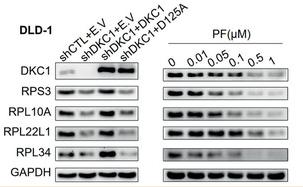
Application: WB    Species: Human    Sample: DLD‐1 and HCT116 cells

Figure 3 Proteomic analysis reveals that DKC1 elicits ribosomal protein expression. A) Volcano plot of differentially expressed proteins obtained from proteomic analysis of triplicate samples of DKC1 knockdown DLD‐1 cells and control cells. A total of 114 downregulated proteins and 58 upregulated proteins were included. B,C) GO enrichment analysis for the cellular component category (B) and KEGG enrichment analysis (C) of differentially expressed proteins. D) Comparison of the mRNA abundance of 28 ribosomal proteins measured by qRT‐PCR and their protein levels measured by proteomic analysis of DKC1 knockdown DLD‐1 cells and control cells (All proteins with P < 0.05). E) qRT‐PCR assays evaluating the mRNA levels of the indicated genes in control and DKC1 knockdown DLD‐1 cells with or without enforced expression of wild‐type DKC1 or the DKC1 mutant (D125A) from three independent experiments (mean ± SD). F) Immunoblots assessing the abundance of the indicated ribosomal proteins in control and DKC1 knockdown DLD‐1 and HCT116 cells with or without enforced expression of wild‐type DKC1 or D125A and PF‐treated DLD‐1 and HCT116 cells (48 h). E.V: empty vector. *P < 0.05, **P < 0.01, ***P < 0.001, ****P < 0.0001, ns: no significance ((D) two‐sided Student's t‐test, (E) one‐way ANOVA with Bonferroni correction).

2). TMT-based quantitative proteomics analysis reveals the attenuated replication mechanism of Newcastle disease virus caused by nuclear localization signal mutation in viral matrix protein. Virulence (PubMed: 32420802) [IF=5.2]

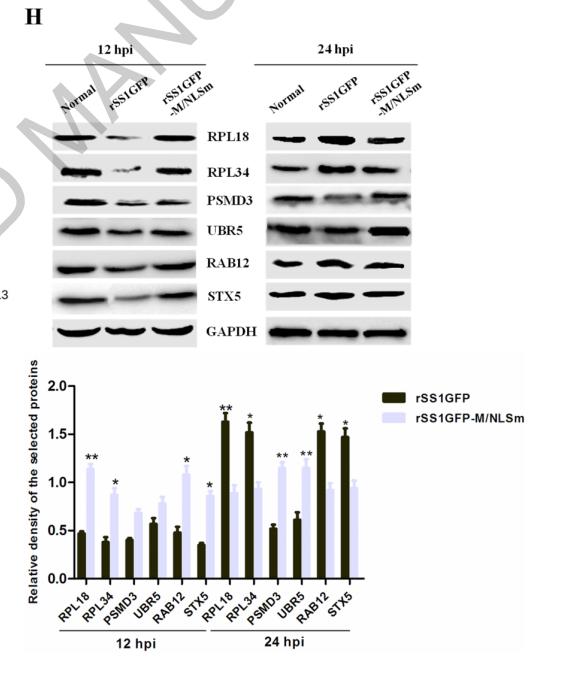
Application: WB    Species: Mouse    Sample: BSR-T7/5 cells

Figure 8. rSS1GFP infection affects the expression of cellular translation, posttranslational modification and trafficking-associated proteins. (A) The heatmap of representative 20 DEPs related to “Translation, ribosomal structure and biogenesis” during rSS1GFP and rSS1GFP-M/NLSm infection at 12 and 24 h. (B) The protein-protein interactions of the DEPs related to “Translation, ribosomal structure and biogenesis” are analyzed by the STRING software. A red line indicates the presence of fusion evidence; a blue line indicates co-occurrence evidence; a light blue line indicates database evidence; a purple line indicates experimental evidence; a green line indicates neighborhood evidence; a black line indicates co-expression evidence. (C) The heatmap of representative 20 DEPs related to “Posttranslational modification, protein turnover, chaperones” during rSS1GFP and rSS1GFP-M/NLSm infection at 12 and 24 h. (D) The protein-protein interactions of the DEPs related to “Posttranslational modification, protein turnover, chaperones” are analyzed by the STRING software. (E) The heatmap of representative 20 DEPs related to “Intracellular trafficking, secretion, and vesicular transport” during rSS1GFP and rSS1GFP-M/NLSm infection at 12 and 24 h. (F) The protein-protein interactions of the DEPs related to “Intracellular trafficking, secretion, and vesicular transport” are analyzed by the STRING software. (G) The mRNA expression levels of six selected DEP genes in BSR-T7/5 cells infected with rSS1GFP and rSS1GFP-M/NLSm were verified by qRT-PCR. (H) The protein expression levels of six DEPs in BSR-T7/5 cells infected with rSS1GFP and rSS1GFP-M/NLSm were examined by Western blotting. The relative expression levels of six DEPs were compared with the control GAPDH expression.

Restrictive clause


Affinity Biosciences tests all products strictly. Citations are provided as a resource for additional applications that have not been validated by Affinity Biosciences. Please choose the appropriate format for each application and consult Materials and Methods sections for additional details about the use of any product in these publications.

For Research Use Only.
Not for use in diagnostic or therapeutic procedures. Not for resale. Not for distribution without written consent. Affinity Biosciences will not be held responsible for patent infringement or other violations that may occur with the use of our products. Affinity Biosciences, Affinity Biosciences Logo and all other trademarks are the property of Affinity Biosciences LTD.