
, using SREBP1 Antibody at 1/1000 dilution.
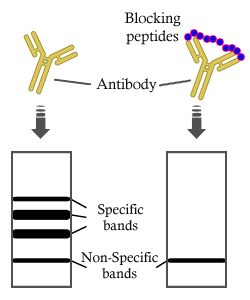
5ug/NC membrane strip.
Exposure for 10s with Affinity™ ECL Kit(#KF8001).
Bands result from membrane strip incubation.")

 and mouse anti-beta tubulin Ab(T0023) for 1 hour at 37°C. An AlexaFluor594 conjugated goat anti-rabbit IgG(H+L) Ab(Red) and an AlexaFluor488 conjugated goat anti-mouse IgG(H+L) Ab(Green) were used as the secondary antibody.
The nuclear counter stain is DAPI (blue).")

 Oil Red O staining observation of liver (×200, scale bars = 100 μm). (B) H&E staining observation of liver (×200, scale bars = 50 μm). (C) The volume density of quantitation of hepatic steatosis (n = 5). (D) The genes expression involved in fatty acid β-oxidation in liver (n = 5). (E) The mRNA expression of genes involved in lipogenesis and FXR in liver (n = 5). (F) Bands of PPARα,PPARγ, ACOX1, FAS, SREBP-1c, SCD1.")

 and silibinin on (A) ACC1 expression by western blotting analysis. Immunohistochemical stainings of (B) SREBP-1 and (C) FAS in liver tissue of mice. Scale bar represents 30 μm. Representative analysis from six animals in each group.Significance is represented as ##P ≤ 0.01 and ###P ≤ 0.001 compared to the normal control group,*P ≤ 0.05 and **P ≤ 0.01 compared to the fructose group.")
 Western blot analysis on the expression of proteins
referred to hepatic lipid synthesis including SREBP-1c, ACC1, p-ACC1, FASN, SCD1 and HMG-CR; (G–H) The mRNA expression of SREBP-1c and HMG-CR. Data are
presented as the mean ± SD (n = 6~8). ##p < 0.01 vs. NC group; *p < 0.05, **p < 0.01 vs. Model group.")
 and liver weight / body weight (4B) of WT and KO mice with 12 weeks of SD or HFD administration were measured (n = 6–9). TG contents in the livers after 12 weeks of diet treatment were measured (n = 6–9) (4C). The protein and mRNA levels of PPARα and SREBP-1C in the liver samples were measured by western blot and RT-PCR, and β-actin was used as the internal reference (4D-F).")
.")
.")
 Relative expression of SREBP-1C protein in the liver of rats; (b) relative expression of CYP7A1 protein in the liver of rats; and(c) electropherogram of hyperlipidemiarelated protein expression in the liver tissue of rats. n = 8; *compared with the NG group, p < .05; **compared with the NG group, p < .01; ##compared with the MG group, p < .01")
 or a hyperuricemia (HUM)-inducing diet for 4 weeks. SREBP1c mRNA levels were determined by real-time PCR and protein levels were detected by western blotting in mouse liver tissues.")
 and (g) Representative Western blot
images with insulin stimulation. (b) The phosphorylation of mTOR. (c) The level of SREBP-1c protein expression. (d) Representative Western blot
images without insulin stimulation. (e) The phosphorylation of mTOR. (f) The level of SREBP-1c protein expression. (h) The level of n-SREBP-1c
protein expression. Data are expressed as the mean ± SEM (n = 3). ##p < .01 versus the insulin only treated group or untreated group; *p < .05,
**p < .01 versus the control (treated with PA only or PA plus insulin) group. mTOR, mammalian target of rapamycin; PA, palmitic acid; Scu,
Scutellarin")
 The hepatic mRNA expressions of AMPKα, SREBP-1c and PPARα. (B) Representative bands of p-AMPKα,
AMPKα, SREBP-1c and PPARα. (C) Quantitative results of Western blot bands densities of p-AMPKα/ AMPKα, SREBP-1c and PPARα. (D) Spearman correlation
between hepatic CD36 expression and AMPK signalling pathway-related proteins indicators, respectively. Data are presented as the mean ± SD (n = 3 ~ 6). ##P <
0.01 vs. NC group; **P < 0.01 vs. Model group.")
 Western blot analysis of the protein expressions of SREBP-1c, FASN, PPARα, CPT1, MTTP and protein ratio of p-foxO1/foxO1 when the mice were injected with AAV-miR-378b agomir and antagomir. All data are expressed as the means ± SD of at least three separate experiments.")
 The relative mRNA expression levels of Acaca, Cd36, Cpt1α, Srebp-1, Hmgcr, Pparα, Pparγ, and Scd1 were determined by qRT-PCR. (i) The lipid metabolism relevant protein levels of SREBP-1, ACOX1, CD36, CPT1α, and HMGCR were analyzed by western blotting, and the relative ratios were calculated. (j–l) Serum IL-6, IL-1β, and TNF-α were identified by ELISA kits. (m, n) The relative mRNA expression levels of IL-1β, TNF-α, and Ccl5 were identified by qRT-PCR. (p) The proinflammatory factor protein levels of IL-1β, IL-6, and TNF-α were analyzed by western blotting, and their relative ratios were calculated. The densitometry was obtained by averaging repeated experiments results, normalized to GAPDH. The data are expressed as the mean ± SD, n = 3. #P < 0.05 means there is significant difference between the NFD group and the HFD group. ∗P < 0.05 means the difference between the HFD group and the FV-L group or the FV-H group is significant.")
. Different lowercase alphabet letters were significantly different at the level of P < 0.05.")
 on expression of lipogenesis and lipid oxidation mRNA and proteins in OA-treated SK-HEP-1 cells (A), and primary murine hepatocytes (B). Cells were treated with 0.5 mM of OA, and different concentrations of MBC (0, 20, 40, 60, and 80μM) for 48 h. Total RNA was isolated using a GENEzol reagent and mRNA was measured using qRT-PCR. Target gene mRNA levels were normalized to a reference gene β-actin. (C) Protein expression of FASN, ACC1, SREBP-1c, PPAR-α and (D) p-AMPK were detected by Western blot. All results are expressed as mean ± SD of three independent experiments. Data bars with similar letters were not significantly different (p ≤ 0.05).")
 The mRNA levels of SREBP-1, ACC1, FAS and SCD-1 at PND21. (b) Protein levels of SREBP-1 and SCD-1 at PND21. (c) The mRNA levels of SREBP-1, ACC1, FAS and SCD-1 at PND56. (d) Protein levels of SREBP-1 and SCD-1 at PND56. Western blot bands represent the detection of the protein from three independent tests. The relative intensities were expressed in the bar chart. All data were normalized to β-actin level within the same lane/blot. Data were shown as means ± SD and analyzed with One-way ANOVA (n = 6). *p < 0.05 vs. Control.")
 Western blot analysis of SREBP1 in HBMECs stimulated with 25 and 50 mM glucose for 72 h (left). β-Actin was used as a loading control. The bar graph (right) shows the densitometric analysis. (B) After HBMECs were cultured in 25 and 50 mM glucose for 72 h, SREBP1 was detected by quantitative reverse transcription–polymerase chain reaction (qRT-PCR). mRNA expression was normalized to β-actin. (C) Immunofluorescence staining of SREBP1 (red) in HBMECs stimulated with 25 and 50 mM glucose for 72 h. Cell nuclei were stained with Hoechst (blue). Scale bar: 50 μm. (D) Cytoplasmic and nuclear extracts from HBMECs treated with 50 mM glucose were immunoblotted using anti-SREBP1 (left). Bar graphs show densitometric analysis of SREBP1 expression in cytoplasmic extracts and nuclear extracts (right). Cultured HBMECs pretreated with or without rapamycin (20 nmol/L) were stimulated with 50 mM glucose. (E) After 72 h, the protein levels of SREBP1 in the whole cell lysate were detected by Western blotting (left). The bar graph shows the quantification of SREBP1 (right). HBMECs were transfected with Raptor siRNA (si-Raptor) and the corresponding negative control (Ctrl.), followed by 50 mM glucose stimulation for 72 h, and then lysis. (F) Western blotting with SREBP1 antibody and (G) relative Raptor (left) and SREBP1 (right) mRNA expressions were detected by quantitative reverse transcription–polymerase chain reaction (qRT-PCR). mRNA expression was normalized to β-actin. (H) Cultured HBMECs pretreated with or without rapamycin (20 nmol/L) were stimulated with 50 mM glucose, and cytoplasmic and nuclear extracts were immunoblotted using anti-SREBP1. (I) Bar graphs show the densitometric analysis of SREBP1 expression in cytoplasmic extracts and nuclear extracts. Data are shown from at least three independent experiments.")
 The mRNA and protein expression levels of FASN and SERBP-1C were increased. PPAR-α and ACOX-1 expression were decreased in NAFLD liver tissues. (Data are represented by at least three independent mean ± SD, *p < 0.05, **p < 0.01 vs normal group).")
 Immunofluorescence imaging of HFr-induced HepG2 cells, (b) SREBP-1c fluorescence intensity quantification (n = 6). (c) Relative mRNA expression of SREBP-1c in the liver, studied by qRT-PCR (n = 6). (d) Total form of SREBP-1c (molecular weight 122kDa) presented by western blotting indicates protein expression levels (n = 3). We investigated relative mRNA expression of downstream markers of SREBP-1c. These are represented as (e) FAS (f) ACC-1 (g) SCD-1. Further, we determined the relative mRNA expression of fat oxidation related genes (h) CPT-1a (i) UCP-2. The mRNA and protein expressions were normalized with corresponding 18s and GAPDH expression, respectively. Results were represented as means ± SEM (n = 6). For (a and b), significance among different groups displayed as β, Control vs HFr; δ, HFr vs HFr + Met; ε, HFr vs HFr + PSTi8; φ, HFr vs HFr + Comb. For (c to i), Significance among groups showed as β, Control vs HVCD; δ, HVCD vs HVCD + Met; ε, HVCD vs HVCD + PSTi8; φ, HVCD vs HVCD + Comb. Significance represented as φp")
; B: Relative mRNA expression levels of AMPKα, SREBP-1C, ACC1 and FASN in HepG2 cells tested by real-time quantitative polymerase chain reaction (n = 3). Data are presented as mean ± SE. aP < 0.05 vs NC group, cP < 0.05 vs MOD group. NC: Negative control group; MOD: Model group; FLHZF: Fanlian Huazhuo Formula group.")
 Mouse body weights were measured in shcontrol and shleptin groups. (B) IHC was performed to investigate the protein expression levels of SREBP1, FASN, and SCD1 in shcontrol and shleptin xenograft tumors. The quantifications of IHC staining are shown. The data are presented as the mean ± SD. ***: p < 0.001; n.s.: not significant.")
 Isolated PMHs were obtained from mice fed the control diet (Pair) or ethanol diet (EtOH) supplemented with or without 3% (w/v) mannose (Man). The protein (A) and mRNA (B) levels of SREBP1c, ACC1 and FASN were evaluated (n = 6). (C) Representative images of SREBP1c staining on the liver sections (n = 3). Scale bars = 100 μm. (D, E) PMHs from WT mice were stimulated by 200 mM ethanol (EtOH) with/without 5 mM mannose (Man) for 24 h, PMHs with cell culture medium as control (Ctrl). The protein (D) and mRNA (E) levels of lipogenic enzyme genes SREBP1c, ACC1, and FASN were evaluated (n = 3). Data are expressed as the means ± SEM of three independent experiments. *p < 0.05, **p < 0.01, ***p < 0.001, ****p < 0.0001, ns, not significant, unpaired two-tailed t-test.")
 The effect of SE on SREBP1 expression in vivo. (B) Summary of Western blot results. (C) Representative IHC pictures of SREBP1 in the SE and control groups. The left images were captured at a magnification of 20 × with a scale bar of 1 mm, the middle images were captured at a magnification of 100 × with a scale bar of 200 μm, and the right images were captured at a magnification of 400 × with a scale bar of 50 μm for each staining. The values were showed as the mean ± SEM (n = 4). *p < 0.05 compared with control group. SE, status epilepticus; Con, control; SREBP1, Sterol regulatory element binding protein 1.")
 CTRP9 mRNA and protein expression levels. (B) ATF6a mRNA and protein expression levels. (C) mRNA and protein expression levels of CRP78. (D) Expression levels of IRE1a mRNA and p-IRE1a protein. (E) Expression levels of PERK mRNA and p-PERK protein. (F) SREBP1c mRNA and protein expression levels. (G) SREBP2 mRNA and protein expression levels. The experiment was performed in triplicate, and the representative images are shown. *P")

 Both miR-466i-3p (A) and miR-669c-3p (B) targeted AMPK-α1 mRNA by the complementation of ‘seed sequence’ (miRNA) and 3′ untranslated region (mRNA). Triangles and circles labeling AMPK-α1 mRNA with serial numbers reflect the complementation sites of miR-466i-3p and miR-669c-3p, respectively. (C–E) miR-466i-3p and miR-669c-3p activation in the NAFLD group led to mRNA decrease in AMPK-α1 (C), whereas transcriptional increase in SREBP1 (D) and FASN (E). (F–I) Western blotting (F) semi-quantitatively confirmed the downregulation of AMPK-α1 (G) and upregulation of both SREBP1 (H) and FASN (I) in the NAFLD group. (J) Immunohistochemical staining revealed the expressive alterations of AMPK-α1, SREBP1, and FASN in hepatocytes. The data was presented as mean ± SEM. *, p < 0.05; **, p < 0.01; ***, p < 0.001.")
 Both miR-466i-3p (A) and miR-669c-3p (B) targeted AMPK-α1 mRNA by the complementation of ‘seed sequence’ (miRNA) and 3′ untranslated region (mRNA). Triangles and circles labeling AMPK-α1 mRNA with serial numbers reflect the complementation sites of miR-466i-3p and miR-669c-3p, respectively. (C–E) miR-466i-3p and miR-669c-3p activation in the NAFLD group led to mRNA decrease in AMPK-α1 (C), whereas transcriptional increase in SREBP1 (D) and FASN (E). (F–I) Western blotting (F) semi-quantitatively confirmed the downregulation of AMPK-α1 (G) and upregulation of both SREBP1 (H) and FASN (I) in the NAFLD group. (J) Immunohistochemical staining revealed the expressive alterations of AMPK-α1, SREBP1, and FASN in hepatocytes. The data was presented as mean ± SEM. *, p < 0.05; **, p < 0.01; ***, p < 0.001.")
 Statistical graph of expression levels of Ampk, p-Ampk, Acly, Srebp-1c, Acaca, Fasn, Scd-1, and β-actin related proteins; (I–L) Statistical graph of expression levels of Cd36, Cpt-1, Ppar-α, and β-actin related proteins. Data are means ± standard deviations (SD, n = 3). #P < 0.05 and ##P < 0.01 compared with the ND group; *P < 0.05, **P < 0.01 and ***P < 0.001 compared with the HFD group.")
 CPT, (b) FAS and (c) Srebp-1c and key proteins including (d) CPT-1α, (e) FAS and (f) Srebp-1c involved in lipid metabolism in OA-treated HepG2 cells. HepG2 cells (106 cells/mL) were incubated with 100 μL CFE of L. acidophilus NX2-6 (108 CFU/mL) for 24 h, after treated with oleic acid (OA) (0.9 mM) for 24 h. Data are presented as mean ± SD of at least three independent experiments. Different lowercase alphabet letters were significantly different at level of p < 0.05.")
| Product: | SREBP1 Antibody |
| Catalog: | AF6283 |
| Description: | Rabbit polyclonal antibody to SREBP1 |
| Application: | WB IHC IF/ICC |
| Cited expt.: | WB, IHC, IF/ICC |
| Reactivity: | Human, Mouse, Rat, Pig, Sheep |
| Prediction: | Pig, Horse, Sheep, Dog |
| Mol.Wt.: | 122kD, 65kD(cleaved)(Observed); 122kD(Calculated). |
| Uniprot: | P36956 |
| RRID: | AB_2835134 |
Control Products
Related Downloads
Protocols
Product Info
*The optimal dilutions should be determined by the end user. For optimal experimental results, antibody reuse is not recommended.
*Tips:
WB: For western blot detection of denatured protein samples. IHC: For immunohistochemical detection of paraffin sections (IHC-p) or frozen sections (IHC-f) of tissue samples. IF/ICC: For immunofluorescence detection of cell samples. ELISA(peptide): For ELISA detection of antigenic peptide.
Cite Format: Affinity Biosciences Cat# AF6283, RRID:AB_2835134.
Fold/Unfold
ADD 1; bHLHd1; Class D basic helix-loop-helix protein 1; D630008H06; Processed sterol regulatory element-binding protein 1; SRBP1_HUMAN; SREBF 1; SREBF1; SREBP 1; SREBP 1c; SREBP-1; SREBP1; Sterol regulatory element binding protein 1; Sterol Regulatory Element Binding Transcription Factor 1 / Protein 1; Sterol regulatory element binding transcription factor 1; Sterol regulatory element-binding transcription factor 1;
Immunogens
A synthesized peptide derived from human SREBP1, corresponding to a region within the internal amino acids.
Expressed in a wide variety of tissues, most abundant in liver and adrenal gland. In fetal tissues lung and liver shows highest expression. Isoform SREBP-1C predominates in liver, adrenal gland and ovary, whereas isoform SREBP-1A predominates in hepatoma cell lines. Isoform SREBP-1A and isoform SREBP-1C are found in kidney, brain, white fat, and muscle.
- P36956 SRBP1_HUMAN:
- Protein BLAST With
- NCBI/
- ExPASy/
- Uniprot
MDEPPFSEAALEQALGEPCDLDAALLTDIEDMLQLINNQDSDFPGLFDPPYAGSGAGGTDPASPDTSSPGSLSPPPATLSSSLEAFLSGPQAAPSPLSPPQPAPTPLKMYPSMPAFSPGPGIKEESVPLSILQTPTPQPLPGALLPQSFPAPAPPQFSSTPVLGYPSPPGGFSTGSPPGNTQQPLPGLPLASPPGVPPVSLHTQVQSVVPQQLLTVTAAPTAAPVTTTVTSQIQQVPVLLQPHFIKADSLLLTAMKTDGATVKAAGLSPLVSGTTVQTGPLPTLVSGGTILATVPLVVDAEKLPINRLAAGSKAPASAQSRGEKRTAHNAIEKRYRSSINDKIIELKDLVVGTEAKLNKSAVLRKAIDYIRFLQHSNQKLKQENLSLRTAVHKSKSLKDLVSACGSGGNTDVLMEGVKTEVEDTLTPPPSDAGSPFQSSPLSLGSRGSGSGGSGSDSEPDSPVFEDSKAKPEQRPSLHSRGMLDRSRLALCTLVFLCLSCNPLASLLGARGLPSPSDTTSVYHSPGRNVLGTESRDGPGWAQWLLPPVVWLLNGLLVLVSLVLLFVYGEPVTRPHSGPAVYFWRHRKQADLDLARGDFAQAAQQLWLALRALGRPLPTSHLDLACSLLWNLIRHLLQRLWVGRWLAGRAGGLQQDCALRVDASASARDAALVYHKLHQLHTMGKHTGGHLTATNLALSALNLAECAGDAVSVATLAEIYVAAALRVKTSLPRALHFLTRFFLSSARQACLAQSGSVPPAMQWLCHPVGHRFFVDGDWSVLSTPWESLYSLAGNPVDPLAQVTQLFREHLLERALNCVTQPNPSPGSADGDKEFSDALGYLQLLNSCSDAAGAPAYSFSISSSMATTTGVDPVAKWWASLTAVVIHWLRRDEEAAERLCPLVEHLPRVLQESERPLPRAALHSFKAARALLGCAKAESGPASLTICEKASGYLQDSLATTPASSSIDKAVQLFLCDLLLVVRTSLWRQQQPPAPAPAAQGTSSRPQASALELRGFQRDLSSLRRLAQSFRPAMRRVFLHEATARLMAGASPTRTHQLLDRSLRRRAGPGGKGGAVAELEPRPTRREHAEALLLASCYLPPGFLSAPGQRVGMLAEAARTLEKLGDRRLLHDCQQMLMRLGGGTTVTSS
Predictions
Score>80(red) has high confidence and is suggested to be used for WB detection. *The prediction model is mainly based on the alignment of immunogen sequences, the results are for reference only, not as the basis of quality assurance.
High(score>80) Medium(80>score>50) Low(score<50) No confidence
Research Backgrounds
Transcriptional activator required for lipid homeostasis. Regulates transcription of the LDL receptor gene as well as the fatty acid and to a lesser degree the cholesterol synthesis pathway (By similarity). Binds to the sterol regulatory element 1 (SRE-1) (5'-ATCACCCCAC-3'). Has dual sequence specificity binding to both an E-box motif (5'-ATCACGTGA-3') and to SRE-1 (5'-ATCACCCCAC-3').
At low cholesterol the SCAP/SREBP complex is recruited into COPII vesicles for export from the ER. In the Golgi complex SREBPs are cleaved sequentially by site-1 and site-2 protease. The first cleavage by site-1 protease occurs within the luminal loop, the second cleavage by site-2 protease occurs within the first transmembrane domain and releases the transcription factor from the Golgi membrane. Apoptosis triggers cleavage by the cysteine proteases caspase-3 and caspase-7.
Phosphorylated by AMPK, leading to suppress protein processing and nuclear translocation, and repress target gene expression. Phosphorylation at Ser-402 by SIK1 represses activity possibly by inhibiting DNA-binding (By similarity).
Endoplasmic reticulum membrane>Multi-pass membrane protein. Golgi apparatus membrane>Multi-pass membrane protein. Cytoplasmic vesicle>COPII-coated vesicle membrane>Multi-pass membrane protein.
Note: Moves from the endoplasmic reticulum to the Golgi in the absence of sterols.
Nucleus.
Nucleus.
Nucleus.
Expressed in a wide variety of tissues, most abundant in liver and adrenal gland. In fetal tissues lung and liver shows highest expression. Isoform SREBP-1C predominates in liver, adrenal gland and ovary, whereas isoform SREBP-1A predominates in hepatoma cell lines. Isoform SREBP-1A and isoform SREBP-1C are found in kidney, brain, white fat, and muscle.
The 9aaTAD motif is a transactivation domain present in a large number of yeast and animal transcription factors.
Belongs to the SREBP family.
Research Fields
· Environmental Information Processing > Signal transduction > AMPK signaling pathway. (View pathway)
· Human Diseases > Endocrine and metabolic diseases > Insulin resistance.
· Human Diseases > Endocrine and metabolic diseases > Non-alcoholic fatty liver disease (NAFLD).
· Organismal Systems > Endocrine system > Insulin signaling pathway. (View pathway)
References

Application: WB Species: human Sample: HSP90 of HepG2 cells

Application: WB Species: Mouse Sample:

Application: WB Species: human Sample: HepG2 cells

Application: WB Species: Mouse Sample:
Restrictive clause
Affinity Biosciences tests all products strictly. Citations are provided as a resource for additional applications that have not been validated by Affinity Biosciences. Please choose the appropriate format for each application and consult Materials and Methods sections for additional details about the use of any product in these publications.
For Research Use Only.
Not for use in diagnostic or therapeutic procedures. Not for resale. Not for distribution without written consent. Affinity Biosciences will not be held responsible for patent infringement or other violations that may occur with the use of our products. Affinity Biosciences, Affinity Biosciences Logo and all other trademarks are the property of Affinity Biosciences LTD.