Product: PDLIM3 Antibody
Catalog: DF12525
Description: Rabbit polyclonal antibody to PDLIM3
Application: WB IHC IF/ICC
Reactivity: Human, Mouse, Rat
Prediction: Dog
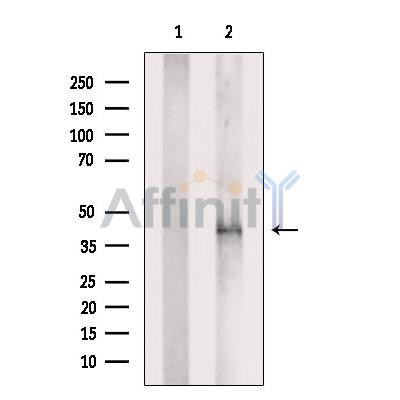
Mol.Wt.: 35,39 kDa; 39kD(Calculated).
Uniprot: Q53GG5
RRID: AB_2845487

View similar products>>

   Size Price Inventory
 100ul $280 In stock
 200ul $350 In stock

Lead Time: Same day delivery

For pricing and ordering contact:
Local distributors

Product Info

Source:
Rabbit
Application:
WB 1:500-1:2000, IHC 1:50-1:200, IF/ICC 1:100-1:500
*The optimal dilutions should be determined by the end user.
*Tips:

WB: For western blot detection of denatured protein samples. IHC: For immunohistochemical detection of paraffin sections (IHC-p) or frozen sections (IHC-f) of tissue samples. IF/ICC: For immunofluorescence detection of cell samples. ELISA(peptide): For ELISA detection of antigenic peptide.

Reactivity:
Human,Mouse,Rat
Prediction:
Dog(83%)
Clonality:
Polyclonal
Specificity:
ALP Antibody detects endogenous levels of total ALP.
RRID:
AB_2845487
Cite Format: Affinity Biosciences Cat# DF12525, RRID:AB_2845487.
Conjugate:
Unconjugated.
Purification:
The antiserum was purified by peptide affinity chromatography using SulfoLink™ Coupling Resin (Thermo Fisher Scientific).
Storage:
Rabbit IgG in phosphate buffered saline , pH 7.4, 150mM NaCl, 0.02% sodium azide and 50% glycerol. Store at -20 °C. Stable for 12 months from date of receipt.
Alias:

Fold/Unfold

Actinin associated LIM protein; Actinin-associated LIM protein; Alpha actinin 2 associated LIM protein; Alpha-actinin-2-associated LIM protein; DKFZp686L0362; Enigma homolog; PDLI3_HUMAN; PDLIM 3; PDLIM3; PDZ and LIM domain 3; PDZ and LIM domain protein 3; ALP;PDLI3;

Immunogens

Immunogen:
Uniprot:
Gene(ID):
Expression:
Q53GG5 PDLI3_HUMAN:

Isoform 1 is highly expressed in differentiated skeletal muscle. Isoform 2 is heart-specific.

Sequence:
MPQTVILPGPAPWGFRLSGGIDFNQPLVITRITPGSKAAAANLCPGDVILAIDGFGTESMTHADAQDRIKAAAHQLCLKIDRGETHLWSPQVSEDGKAHPFKINLESEPQDGNYFEHKHNIRPKPFVIPGRSSGCSTPSGIDCGSGRSTPSSVSTVSTICPGDLKVAAKLAPNIPLEMELPGVKIVHAQFNTPMQLYSDDNIMETLQGQVSTALGETPLMSEPTASVPPESDVYRMLHDNRNEPTQPRQSGSFRVLQGMVDDGSDDRPAGTRSVRAPVTKVHGGSGGAQRMPLCDKCGSGIVGAVVKARDKYRHPECFVCADCNLNLKQKGYFFIEGELYCETHARARTKPPEGYDTVTLYPKA

Predictions

Predictions:

Score>80(red) has high confidence and is suggested to be used for WB detection. *The prediction model is mainly based on the alignment of immunogen sequences, the results are for reference only, not as the basis of quality assurance.

Species
Results
Score
Dog
83
Pig
71
Horse
67
Bovine
67
Sheep
67
Chicken
57
Rabbit
57
Xenopus
0
Zebrafish
0
Model Confidence:
High(score>80) Medium(80>score>50) Low(score<50) No confidence

PTMs - Q53GG5 As Substrate

Site PTM Type Enzyme
S18 Phosphorylation
T57 Phosphorylation
S89 Phosphorylation
S93 Phosphorylation
S133 Phosphorylation
S136 Phosphorylation
T137 Phosphorylation
S145 Phosphorylation
S148 Phosphorylation
T149 Phosphorylation
S151 Phosphorylation
S250 Phosphorylation
S264 Phosphorylation
S299 Phosphorylation
Y312 Phosphorylation
Y355 Phosphorylation
T357 Phosphorylation
Y361 Phosphorylation

Research Backgrounds

Function:

May play a role in the organization of actin filament arrays within muscle cells.

Subcellular Location:

Cytoplasm>Myofibril>Sarcomere>Z line.
Note: Localizes to myofiber Z-lines.

Extracellular region or secreted Cytosol Plasma membrane Cytoskeleton Lysosome Endosome Peroxisome ER Golgi apparatus Nucleus Mitochondrion Manual annotation Automatic computational assertionSubcellular location
Tissue Specificity:

Isoform 1 is highly expressed in differentiated skeletal muscle. Isoform 2 is heart-specific.

Subunit Structure:

Interacts with ACTN2 (By similarity). Forms a heterodimer with PDLIM4 (via LIM domain) (By similarity).

References

1). Osteoblastic and anti-osteoclastic activities of strontium-substituted silicocarnotite ceramics: In vitro and in vivo studies. Bioactive Materials, 2020 (PubMed: 32280833) [IF=18.9]

Application: IHC    Species: Mice    Sample: bone and osteoid tissues

Fig. 9 (A) Masson staining: the region between surrounding bone and scaffold (40x & 100x); (B) TRAP staining: TRAP positive cells (black arrows); (C) IHC staining of RUNX-2; (D) IHC staining of ALP; (E) Quantitative analysis for TRAP staining and IHC staining. * Compared with CPS group; # compared with Sr-5 group.

2). Fusion peptide engineered “statically-versatile” titanium implant simultaneously enhancing anti-infection, vascularization and osseointegration. Biomaterials, 2021 (PubMed: 33069134) [IF=14.0]

3). On-demand storage and release of antimicrobial peptides using Pandora's box-like nanotubes gated with a bacterial infection-responsive polymer. Theranostics, 2020 (PubMed: 31903109) [IF=12.4]

Application: WB    Species: Human    Sample: Human bone mesenchymal stem cells(hBMSCs)

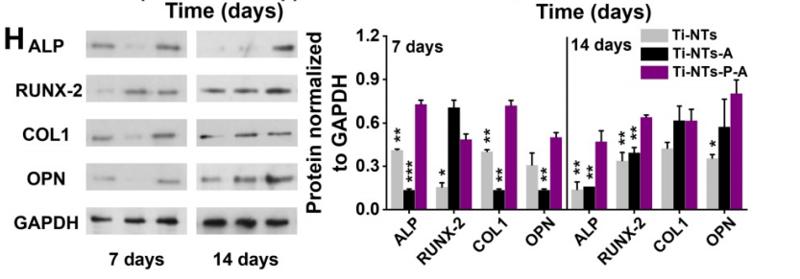
Figure 5. In vitro biocompatibilities and osteogenic activities of the substrates. (A) CCK-8 assay of hBMSCs on the indicated surfaces after 1, 3 and 7 days of culture. * denotes p < 0.05 and ** denotes p < 0.01 compared to Ti-NTs, # denotes p < 0.05 compared to the corresponding control group without peptides. Error bars denote the standard deviations over quadruplicate measurements with separately implants. (B) Confocal fluorescence microscopy images of hBMSCs stained with vinculin, F-actin and DAPI after being cultured for 24 h. Scale bar, 50 μm. (C-F) qRT-PCR assay of osteogenic gene expression of (C) ALP, (D) RUNX-2, (E) COL1 and (F) OPN of hBMSCs after 7 and 14 days of culture. * denotes p < 0.05, ** denotes p < 0.01 and *** denotes p < 0.001 compared to Ti-NTs-P-A; # denotes p < 0.05, & denotes p < 0.01 and $ denotes p < 0.001 compared to the corresponding control group without peptides. All error bars denote the standard deviations over quadruplicate measurements with separately implants. (G) Immunofluorescence staining of hBMSCs cultured on Ti-NTs-P-A for 7 days (ALP and RUNX-2) and 14 days (OPN). The images were obtained by confocal fluorescence microscopy. Scale bar, 50 μm. (H) Western blotting of hBMSCs cultured on the substrates for 7 and 14 days. At each time point, left lane was Ti-NTs, middle lane was Ti-NTs-A and right lane was Ti-NTs-P-A. * denotes p < 0.05, ** denotes p < 0.01 and *** denotes p < 0.001 compared to Ti-NTs-P-A. Error bars denote the standard deviations over triplicate measurements with separately Western blotting results.

4). ZIF-8 Modified Multifunctional Bone-Adhesive Hydrogels Promoting Angiogenesis and Osteogenesis for Bone Regeneration. ACS Applied Materials & Interfaces, 2020 (PubMed: 32814397) [IF=9.5]

5). MagT1 regulated the odontogenic differentiation of BMMSCs induced byTGC-CM via ERK signaling pathway. Stem Cell Research & Therapy, 2019 (PubMed: 30704530) [IF=7.5]

Application: WB    Species: rat    Sample: BMMSCs

Fig. 4 |Inactivation of ERK/MAPK signaling pathway inhibited the odontogenic differentiation of BMMSCs induced by TGC-CM. a ERK inhibitor U0126 significantly inhibited the mineralization and b reduced ALP, DSP, and DMP-1 protein levels of BMMSCs during odontogenic differentiation induced by TGC-CM for 7 days. Scale bar = 100 μm

6). VX-765 ameliorates CKD VSMC calcification by regulating STAT3 activation. European Journal of Pharmacology, 2023 (PubMed: 36858340) [IF=5.0]

7). Beta-tricalcium phosphate promotes osteogenic differentiation of bone marrow-derived mesenchymal stem cells through macrophages. Biomedical Materials, 2021 (PubMed: 33445164) [IF=4.0]

8). P53 negatively regulates the osteogenic differentiation in jaw bone marrow MSCs derived from diabetic osteoporosis. Heliyon, 2023 (PubMed: 37096002) [IF=4.0]

Application: WB    Species: Human    Sample: hJBMMSCs

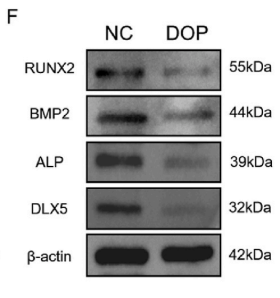
Fig. 2. Comparison of osteogenic differentiation ability between NC and DOP(diabetic osteoporosis) hJBMMSCs. A. The ALP staining area was smaller and the color was lighter in DOP group than NC group on the 10th day (Mean ± SD, n = 6). B. The ALP activity was lower in DOP group than NC group after 7 days and 14 days of osteogenic induction (Mean ± SD, n = 6). C. After osteogenic induction, ARS (alizarin red S) staining on the 21st day showed that the number of mineralized nodules in DOP group was significantly less than that in NC group (Mean ± SD, n = 6). D. semiquantitative analysis showed that the OD (optical density) value of DOP group was significantly lower than that of NC group (Mean ± SD, n = 6). E. After osteogenic induction, the mRNA expressions of RUNX2, BMP2,ALP, OCN, SP7 and DLX5 in DOP group were significantly lower than those in NC group (Mean ± SD, n = 3). F. The protein expressions of RUNX2, BMP2, ALP and DLX5 in DOP group were significantly lower than those in NC group (Mean ± SD, n = 3). **P < 0.01,***P < 0.001.

9). Melatonin Repairs Osteoporotic Bone Defects in Iron-Overloaded Rats through PI3K/AKT/GSK-3β/P70S6k Signaling Pathway. Oxidative Medicine and Cellular Longevity, 2023 (PubMed: 36703914)

Application: WB    Species: Mouse    Sample: MC3T3-E1 cells

Figure 3 Iron-overloaded MC3T3-E1 cells are more capable of osteogenic mineralization when treated with MT. (a) Alkaline phosphatase expression in MC3T3-E1 cells in each group was determined using an ALP staining. Images obtained from a gross scanner are shown on the left (scale bar: 1 mm), enlarged images are displayed in the middle (magnification: 100 and scale bar: 250 μm), and the quantitative results of the gross scanner images are displayed on the right. (b) ALP, Runx2, BMP2, and OCN mRNA expressions in MC3T3-E1 cells in each group were determined by RT-PCR. (c) Alizarin red S staining was used to identify each group's osteogenic mineralization of MC3T3-E1 cells. Images obtained from a gross scanner are shown on the left (scale bar: 1 mm), magnified images are displayed in the middle (magnification: 100 and scale bar: 250 μm), and a quantitative analysis of the left gross scanning images is displayed on the right. (d) The protein expression of OCN, ALP, Runx2, and BMP2 in MC3T3-E1 cells was determined by using Western blotting. ALP stands for alkaline phosphatase, RUNX2 for runt-related transcription factor 2, OCN for osteocalcin, and BMP2 for bone morphogenetic protein 2;

Restrictive clause


Affinity Biosciences tests all products strictly. Citations are provided as a resource for additional applications that have not been validated by Affinity Biosciences. Please choose the appropriate format for each application and consult Materials and Methods sections for additional details about the use of any product in these publications.

For Research Use Only.
Not for use in diagnostic or therapeutic procedures. Not for resale. Not for distribution without written consent. Affinity Biosciences will not be held responsible for patent infringement or other violations that may occur with the use of our products. Affinity Biosciences, Affinity Biosciences Logo and all other trademarks are the property of Affinity Biosciences LTD.