Product: Phospho-MFF (Ser172/Ser146) Antibody
Catalog: AF2365
Description: Rabbit polyclonal antibody to Phospho-MFF (Ser172/Ser146)
Application: WB IHC
Reactivity: Human
Prediction: Rabbit
Mol.Wt.: 25, 27kDa; 38kD(Calculated).
Uniprot: Q9GZY8
RRID: AB_2845379

View similar products>>

   Size Price Inventory
 100ul $280 In stock
 200ul $350 In stock

Lead Time: Same day delivery

For pricing and ordering contact:
Local distributors

Product Info

Source:
Rabbit
Application:
WB 1:500-1:2000, IHC 1:50-1:200
*The optimal dilutions should be determined by the end user.
*Tips:

WB: For western blot detection of denatured protein samples. IHC: For immunohistochemical detection of paraffin sections (IHC-p) or frozen sections (IHC-f) of tissue samples. IF/ICC: For immunofluorescence detection of cell samples. ELISA(peptide): For ELISA detection of antigenic peptide.

Reactivity:
Human
Prediction:
Rabbit(86%)
Clonality:
Polyclonal
Specificity:
Phospho-MFF (Ser172/Ser146) Antibody detects endogenous levels of MFF only when phosphorylated at Ser172/146.
RRID:
AB_2845379
Cite Format: Affinity Biosciences Cat# AF2365, RRID:AB_2845379.
Conjugate:
Unconjugated.
Purification:
The antibody is from purified rabbit serum by affinity purification via sequential chromatography on phospho-peptide and non-phospho-peptide affinity columns.
Storage:
Rabbit IgG in phosphate buffered saline , pH 7.4, 150mM NaCl, 0.02% sodium azide and 50% glycerol. Store at -20 °C. Stable for 12 months from date of receipt.
Alias:

Fold/Unfold

C2orf33; Chromosome 2 open reading frame 33; DKFZp666J168; GL004; Mff; MFF_HUMAN; MGC110913; Mitochondrial fission factor; OTTHUMP00000164235;

Immunogens

Immunogen:
Uniprot:
Gene(ID):
Expression:
Q9GZY8 MFF_HUMAN:

Highly expressed in heart, kidney, liver, brain, muscle, and stomach.

Sequence:
MSKGTSSDTSLGRVSRAAFPSPTAAEMAEISRIQYEMEYTEGISQRMRVPEKLKVAPPNADLEQGFQEGVPNASVIMQVPERIVVAGNNEDVSFSRPADLDLIQSTPFKPLALKTPPRVLTLSERPLDFLDLERPPTTPQNEEIRAVGRLKRERSMSENAVRQNGQLVRNDSLWHRSDSAPRNKISRFQAPISAPEYTVTPSPQQARVCPPHMLPEDGANLSSARGILSLIQSSTRRAYQQILDVLDENRRPVLRGGSAAATSNPHHDNVRYGISNIDTTIEGTSDDLTVVDAASLRRQIIKLNRRLQLLEEENKERAKREMVMYSITVAFWLLNSWLWFRR

Predictions

Predictions:

Score>80(red) has high confidence and is suggested to be used for WB detection. *The prediction model is mainly based on the alignment of immunogen sequences, the results are for reference only, not as the basis of quality assurance.

Species
Results
Score
Rabbit
86
Sheep
75
Horse
71
Xenopus
71
Chicken
71
Pig
50
Bovine
0
Dog
0
Zebrafish
0
Model Confidence:
High(score>80) Medium(80>score>50) Low(score<50) No confidence

PTMs - Q9GZY8 As Substrate

Site PTM Type Enzyme
S21 Phosphorylation
Y35 Phosphorylation
Y39 Phosphorylation
T40 Phosphorylation
K54 Ubiquitination
S74 Phosphorylation
S93 Phosphorylation
T106 Phosphorylation
K109 Ubiquitination
K114 Ubiquitination
T115 Phosphorylation
T121 Phosphorylation
S123 Phosphorylation
T137 Phosphorylation
T138 Phosphorylation
S155 Phosphorylation Q13131 (PRKAA1)
S157 Phosphorylation
S172 Phosphorylation Q13131 (PRKAA1)
S177 Phosphorylation
S179 Phosphorylation
T200 Phosphorylation
S202 Phosphorylation
S222 Phosphorylation
S223 Phosphorylation
S229 Phosphorylation
S233 Phosphorylation
S258 Phosphorylation
S263 Phosphorylation
K302 Ubiquitination

Research Backgrounds

Function:

Plays a role in mitochondrial and peroxisomal fission. Promotes the recruitment and association of the fission mediator dynamin-related protein 1 (DNM1L) to the mitochondrial surface. May be involved in regulation of synaptic vesicle membrane dynamics by recruitment of DNM1L to clathrin-containing vesicles.

Subcellular Location:

Mitochondrion outer membrane>Single-pass type IV membrane protein. Peroxisome. Cytoplasmic vesicle>Secretory vesicle>Synaptic vesicle.

Extracellular region or secreted Cytosol Plasma membrane Cytoskeleton Lysosome Endosome Peroxisome ER Golgi apparatus Nucleus Mitochondrion Manual annotation Automatic computational assertionSubcellular location
Tissue Specificity:

Highly expressed in heart, kidney, liver, brain, muscle, and stomach.

Subunit Structure:

Homodimer. Interacts with DNM1L (By similarity).

Family&Domains:

Belongs to the Tango11 family.

References

1). AMPK is a mechano-metabolic sensor linking cell adhesion and mitochondrial dynamics to Myosin-dependent cell migration. Nature Communications (PubMed: 37217519) [IF=16.6]

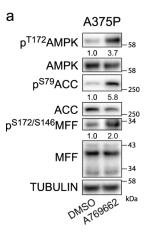
Application: WB    Species: Human    Sample: A375P cells

Fig. 5: Mitochondrial dynamics in 3D migration. a Upon AMPK activation (A769662 10 μM, 30 min) in A375P cells, western blot of the indicated proteins (n = 3). b (Left) Representative images of mitochondrial network (Tom20, green), F-actin (red) and nucleus (Hoechst, blue) after A769662 treatment (10 μM, 24 h). Scale bar = 5 μm. (Right) Quantification of mitochondrial branches per cell from Tom20 staining (10, 17 cells pooled from n = 3). c Western blot of the indicated proteins after AMPK knock-down in A375M2 cells (n = 3). d (Left) Representative images of mitochondrial network (Tom20 (green), F-actin (red) and nucleus (Hoechst, blue)) after AMPK knock-down. Scale bar = 5 μm. (Right) Quantification of mitochondrial branches per cell from Tom20 staining (14, 13 cells pooled from n = 3). e Live cell imaging of mitochondria using MitoTracker Deep Red of the indicated cell lines stably transfected with LifeAct-GFP. Bottom panel show MitoTracker Deep Red segmentation used for quantification. Scale bar = 10 μm. Quantification of mitochondrial branches per cell from Tom20 staining (12, 20, 14, 30 cells pooled from n = 3). f Representative images of TMRE (red) and mitoTracker Green (green). Quantification of TMRE fluorescence intensity per cell (15 cells pooled from n = 3). g (Left) Representative images of mitochondrial network (Tom20, green), F-actin (red) and nucleus (Hoechst, blue) after DDR1 knock-down and Comp C treatment (2 μM, 24 h). Scale bar = 5 μm. (Right) Quantification of mitochondrial branches per cell from Tom20 staining (11, 10, 20, 10 cells pooled from n = 3). Western blot quantifications normalized by each total protein (a, c). Cells seeded on a collagen I matrix (b, d, e, f, g). Dot plots (b, d, e, f, g) show median with interquartile range (each dot represents a single cell). p values were calculated using two-tailed tests (b, d–f). p value by unpaired t-test (b, d, e, f) and Kruskal–Wallis with Dunn’s multiple comparisons test (g). All n are indicative of independent experiments unless otherwise stated. Source data are provided as a Source Data file.

2). Microcystin-leucine-arginine induced neurotoxicity by initiating mitochondrial fission in hippocampal neurons. Science of The Total Environment (PubMed: 31753492) [IF=9.8]

3). Caffeine promotes angiogenesis through modulating endothelial mitochondrial dynamics. Acta Pharmacologica Sinica (PubMed: 33664417) [IF=8.2]

Application: WB    Species: Mouse    Sample:

Fig. 6 The cAMP/PKA/AMPK signaling pathway contributes to caffeine-induced mitochondrial fission and mitochondrial distribution to lamellipodia region. HUVECs were incubated with vehicle or caffeine (50 μM) in the presence or absence of H89 (10 μM) or compound C (5 μM) for the indicated durations. a, b Representative mitochondria from HUVECs cultured for 6 h (n = 3). Scale bar, 25 μm. c–e Representative images and quantification of the lamellipodia extent (d; n = 10) and relative fluorescent intensity of mitochondria in the lamellipodia region (e; n = 5) in HUVECs cultured for 12 h. Scale bar, 25 μm. f, g Western blot analysis of p-MFF protein levels in HUVECs incubated with vehicle or caffeine (50 μM) in the presence of 8-Br-cAMP (200 μM), H89 (10 μM), or compound C (5 μM) for 2 h (n = 3). *P 

4). Mitochondrial Biology in Health, Aging, and Disease: PTPMT1 protects cardiomyocytes from necroptosis induced by γ-ray irradiation through alleviating mitochondria injury. American Journal of Physiology - Cell Physiology (PubMed: 37154493) [IF=5.5]

5). PTPMT1 protects cardiomyocytes from necroptosis induced by γ-ray irradiation through alleviating mitochondria injury. American Journal of Physiology-Cell Physiology (PubMed: 37154493) [IF=5.5]

Application: WB    Species: Rat    Sample:

Figure 3. Effects of γ-ray irradiation on AMPK, DRP1 and MFF signaling and changes in PTPMT1 expression in iPSC-CMs. qPCR (A) and Western blotting (B) were used to determine the expression of AMPK, and the histogram shows the quantitative results of B (C). Western blotting was used to determine the expression of fission-related proteins (p-DRP-1 and p-MFF; D), and the quantitative results are shown (E). qPCR (F) and Western blotting (G) were used to determine the gene expression level of PTPMT1, and the quantitative results of G are shown (H). Data are expressed as the means ± SE, n = 3 (replicates). One-way ANOVA was used for statistical analysis. *P < 0.05, **P < 0.01, ***P < 0.001, ****P < 0.0001, vs. 0 Gy group; ##P < 0.01, ###P < 0.001, ####P < 0.0001, vs. 10 Gy group. iPSC-CMs, induced pluripotent stem cell-derived cardiomyocytes; p-DRP1, phosphorylated-dynamin-related protein 1; p-MFF, phosphorylated-mitochondrial fission factor; PTPMT1, protein tyrosine phosphatase, mitochondrial 1.

6). Blocking exosomal secretion aggravates 1, 4‐Benzoquinone‐induced mitochondrial fission activated by the AMPK/MFF/Drp1 pathway in HL‐60 cells. JOURNAL OF APPLIED TOXICOLOGY (PubMed: 35383983) [IF=3.3]

7). M1 Microglia Induced Neuronal Injury on Ischemic Stroke via Mitochondrial Crosstalk between Microglia and Neurons. Oxidative Medicine and Cellular Longevity (PubMed: 36478988)

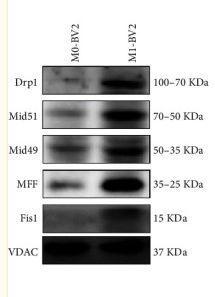
Application: WB    Species: Mouse    Sample: M0-BV2 and M1-BV2 cells

Figure 3 Mitochondrial changes in activated microglia (M1). (a) Schematic diagram of intracellular mitochondrial fusion and fission process in microglia after OGD/R. (b) Western blot assay of mitochondrial fusion protein (Opa1 and Mfn1), TOM20, and cytochrome c in mitochondria of M0 and M1 microglia (n = 3). Results are displayed in a form of mean ± SD; ∗P < 0.05, ∗∗P < 0.01, and ∗∗∗P < 0.001. (c) Western blotting findings of mitochondrial fission protein including MFF, Fis1, Mid49, and Mid51 in mitochondria of M0 and M1 microglia (n = 3). Data presented are mean ± SD; ∗∗P < 0.01 and ∗∗∗P < 0.001. (d) Mitochondrial function in M1 microglia and M0 microglia was investigated by determining ATP (n = 3), mitochondria membrane potential (n = 3), and ROS (n = 3). The relative ratio of intracellular ATP was determined by calculating the ratio of level of ATP in M0-BV2 and M1-BV2 cells to level of ATP in M0-BV2 cells. Results are displayed in a form of mean ± SD. ∗∗P < 0.01 and ∗∗∗P < 0.001. (e) Morphology of intracellular mitochondria in BV2 cells visualized under TEM, scale bar: 1.0 μm.

8). Activity-dependent subcellular compartmentalization of dendritic mitochondria structure in CA1 pyramidal neurons. bioRxiv (PubMed: 36993655)

Restrictive clause


Affinity Biosciences tests all products strictly. Citations are provided as a resource for additional applications that have not been validated by Affinity Biosciences. Please choose the appropriate format for each application and consult Materials and Methods sections for additional details about the use of any product in these publications.

For Research Use Only.
Not for use in diagnostic or therapeutic procedures. Not for resale. Not for distribution without written consent. Affinity Biosciences will not be held responsible for patent infringement or other violations that may occur with the use of our products. Affinity Biosciences, Affinity Biosciences Logo and all other trademarks are the property of Affinity Biosciences LTD.