
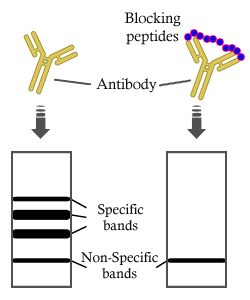
, blocked with antigen-specific peptides.
Lane 2: HepG2 cells(h2o2 treatment).
Lane 3: Raw264.7 cells(uv treatment).")


 LDL-C, (B) HDL-C, and (C) TC in the liver. (D) Representative liver sections stained with Oil Red O. (E–I) The protein expression levels of ACC1, FAS, SREBP-1c and LXRα in the liver were analyzed by Western blotting. (J) ROS concentration in mice detected using DHE probe. (K) 4-HNE expression was analyzed by IHC analysis.")
 Western blot analysis of lipogenesis-related proteins. (B) Fold protein expression of SREBP-1C, FAS, and the ratio of P-ACC/ACC. Three bands are used for statistics. The data are presented as the mean±SD, and significant differences between the two groups were analyzed with the independent-samples t-test. *P")
 The expressions of ACLY, FASN, ACC, SCD1, and SREBP1c at the mRNA level as determined using qRT-PCR. (B-C) Western blot and densitometry analysis. The relative intensities of proteins were calculated after normalization to β-Actin. (D-E) Immunofluorescence staining and quantification of FASN, scale bar: 20 μm. Data represent the means ± SE from three independent experiments (A and C) or from three independent experiments with 2 duplicates (E). Statistical analysis was performed using one-way ANOVA with post hoc Bonferroni’s correction test. Groups containing different lowercase letters (a-e) indicate statistical significance at the level of p < 0.05.")

| Product: | SREBP1 Antibody |
| Catalog: | AF4728 |
| Description: | Rabbit polyclonal antibody to SREBP1 |
| Application: | WB IHC |
| Cited expt.: | WB |
| Reactivity: | Human, Mouse, Rat |
| Prediction: | Pig, Horse, Sheep, Dog, Chicken |
| Mol.Wt.: | 122kDa(Observed); 122kD(Calculated). |
| Uniprot: | P36956 |
| RRID: | AB_2811173 |
Control Products
Related Downloads
Protocols
Product Info
*The optimal dilutions should be determined by the end user. For optimal experimental results, antibody reuse is not recommended.
*Tips:
WB: For western blot detection of denatured protein samples. IHC: For immunohistochemical detection of paraffin sections (IHC-p) or frozen sections (IHC-f) of tissue samples. IF/ICC: For immunofluorescence detection of cell samples. ELISA(peptide): For ELISA detection of antigenic peptide.
Cite Format: Affinity Biosciences Cat# AF4728, RRID:AB_2811173.
Fold/Unfold
ADD 1; bHLHd1; Class D basic helix-loop-helix protein 1; D630008H06; Processed sterol regulatory element-binding protein 1; SRBP1_HUMAN; SREBF 1; SREBF1; SREBP 1; SREBP 1c; SREBP-1; SREBP1; Sterol regulatory element binding protein 1; Sterol Regulatory Element Binding Transcription Factor 1 / Protein 1; Sterol regulatory element binding transcription factor 1; Sterol regulatory element-binding transcription factor 1;
Immunogens
A synthesized peptide derived from human SREBP1, corresponding to a region within the internal amino acids.
Expressed in a wide variety of tissues, most abundant in liver and adrenal gland. In fetal tissues lung and liver shows highest expression. Isoform SREBP-1C predominates in liver, adrenal gland and ovary, whereas isoform SREBP-1A predominates in hepatoma cell lines. Isoform SREBP-1A and isoform SREBP-1C are found in kidney, brain, white fat, and muscle.
- P36956 SRBP1_HUMAN:
- Protein BLAST With
- NCBI/
- ExPASy/
- Uniprot
MDEPPFSEAALEQALGEPCDLDAALLTDIEDMLQLINNQDSDFPGLFDPPYAGSGAGGTDPASPDTSSPGSLSPPPATLSSSLEAFLSGPQAAPSPLSPPQPAPTPLKMYPSMPAFSPGPGIKEESVPLSILQTPTPQPLPGALLPQSFPAPAPPQFSSTPVLGYPSPPGGFSTGSPPGNTQQPLPGLPLASPPGVPPVSLHTQVQSVVPQQLLTVTAAPTAAPVTTTVTSQIQQVPVLLQPHFIKADSLLLTAMKTDGATVKAAGLSPLVSGTTVQTGPLPTLVSGGTILATVPLVVDAEKLPINRLAAGSKAPASAQSRGEKRTAHNAIEKRYRSSINDKIIELKDLVVGTEAKLNKSAVLRKAIDYIRFLQHSNQKLKQENLSLRTAVHKSKSLKDLVSACGSGGNTDVLMEGVKTEVEDTLTPPPSDAGSPFQSSPLSLGSRGSGSGGSGSDSEPDSPVFEDSKAKPEQRPSLHSRGMLDRSRLALCTLVFLCLSCNPLASLLGARGLPSPSDTTSVYHSPGRNVLGTESRDGPGWAQWLLPPVVWLLNGLLVLVSLVLLFVYGEPVTRPHSGPAVYFWRHRKQADLDLARGDFAQAAQQLWLALRALGRPLPTSHLDLACSLLWNLIRHLLQRLWVGRWLAGRAGGLQQDCALRVDASASARDAALVYHKLHQLHTMGKHTGGHLTATNLALSALNLAECAGDAVSVATLAEIYVAAALRVKTSLPRALHFLTRFFLSSARQACLAQSGSVPPAMQWLCHPVGHRFFVDGDWSVLSTPWESLYSLAGNPVDPLAQVTQLFREHLLERALNCVTQPNPSPGSADGDKEFSDALGYLQLLNSCSDAAGAPAYSFSISSSMATTTGVDPVAKWWASLTAVVIHWLRRDEEAAERLCPLVEHLPRVLQESERPLPRAALHSFKAARALLGCAKAESGPASLTICEKASGYLQDSLATTPASSSIDKAVQLFLCDLLLVVRTSLWRQQQPPAPAPAAQGTSSRPQASALELRGFQRDLSSLRRLAQSFRPAMRRVFLHEATARLMAGASPTRTHQLLDRSLRRRAGPGGKGGAVAELEPRPTRREHAEALLLASCYLPPGFLSAPGQRVGMLAEAARTLEKLGDRRLLHDCQQMLMRLGGGTTVTSS
Predictions
Score>80(red) has high confidence and is suggested to be used for WB detection. *The prediction model is mainly based on the alignment of immunogen sequences, the results are for reference only, not as the basis of quality assurance.
High(score>80) Medium(80>score>50) Low(score<50) No confidence
Research Backgrounds
Transcriptional activator required for lipid homeostasis. Regulates transcription of the LDL receptor gene as well as the fatty acid and to a lesser degree the cholesterol synthesis pathway (By similarity). Binds to the sterol regulatory element 1 (SRE-1) (5'-ATCACCCCAC-3'). Has dual sequence specificity binding to both an E-box motif (5'-ATCACGTGA-3') and to SRE-1 (5'-ATCACCCCAC-3').
At low cholesterol the SCAP/SREBP complex is recruited into COPII vesicles for export from the ER. In the Golgi complex SREBPs are cleaved sequentially by site-1 and site-2 protease. The first cleavage by site-1 protease occurs within the luminal loop, the second cleavage by site-2 protease occurs within the first transmembrane domain and releases the transcription factor from the Golgi membrane. Apoptosis triggers cleavage by the cysteine proteases caspase-3 and caspase-7.
Phosphorylated by AMPK, leading to suppress protein processing and nuclear translocation, and repress target gene expression. Phosphorylation at Ser-402 by SIK1 represses activity possibly by inhibiting DNA-binding (By similarity).
Endoplasmic reticulum membrane>Multi-pass membrane protein. Golgi apparatus membrane>Multi-pass membrane protein. Cytoplasmic vesicle>COPII-coated vesicle membrane>Multi-pass membrane protein.
Note: Moves from the endoplasmic reticulum to the Golgi in the absence of sterols.
Nucleus.
Nucleus.
Nucleus.
Expressed in a wide variety of tissues, most abundant in liver and adrenal gland. In fetal tissues lung and liver shows highest expression. Isoform SREBP-1C predominates in liver, adrenal gland and ovary, whereas isoform SREBP-1A predominates in hepatoma cell lines. Isoform SREBP-1A and isoform SREBP-1C are found in kidney, brain, white fat, and muscle.
The 9aaTAD motif is a transactivation domain present in a large number of yeast and animal transcription factors.
Belongs to the SREBP family.
Research Fields
· Environmental Information Processing > Signal transduction > AMPK signaling pathway. (View pathway)
· Human Diseases > Endocrine and metabolic diseases > Insulin resistance.
· Human Diseases > Endocrine and metabolic diseases > Non-alcoholic fatty liver disease (NAFLD).
· Organismal Systems > Endocrine system > Insulin signaling pathway. (View pathway)
References
Application: WB Species: Mouse Sample: livers

Application: WB Species: Rat Sample:

Application: WB Species: Mouse Sample:
Application: WB Species: Rat Sample: liver tissue
Application: WB Species: Mice Sample: gastrocnemius

Application: WB Species: human Sample: HepG2 cells
Restrictive clause
Affinity Biosciences tests all products strictly. Citations are provided as a resource for additional applications that have not been validated by Affinity Biosciences. Please choose the appropriate format for each application and consult Materials and Methods sections for additional details about the use of any product in these publications.
For Research Use Only.
Not for use in diagnostic or therapeutic procedures. Not for resale. Not for distribution without written consent. Affinity Biosciences will not be held responsible for patent infringement or other violations that may occur with the use of our products. Affinity Biosciences, Affinity Biosciences Logo and all other trademarks are the property of Affinity Biosciences LTD.