
 and autolysosome structures (denoted by red triangles) (a). Western blotting analysis showed that the LC3-II expression was significantly higher in the model group than in the sham group (P < 0 001) but was decreased in the ATL-III-treated group(P < 0 05); the expression of P62 followed an opposite trend (c).")
 for 48 hours. Cell apoptosis was detected via flow cytometry analysis. The apoptotic ratio was calculated as the percentage of early apoptotic (Annexin V+/PI-) cells plus late apoptotic (Annexin V+/PI+) cells (A,B).The expression of apoptosis-related proteins and autophagy markers was measured via Western blot analysis (C,D).")
 The degree of pulmonary artery remodeling in MCT-treated mice increased significantly compared with control mice. (B) Analysis of pulmonary arteries. (C) Western blot analysis using lung tissue samples showing significantly increased expression levels of SUMO1, HIF-1α and autophagy marker LC3b, and a significantly decreased expression level of autophagy marker p62 in MCT-treated mice than in control mice. (D) Western blot data in (C) were quantified and plotted.")
 Autophagy related proteins LC3-II/LC3-I, Beclin-1, and P62 were detected and quantified by Western blot in THP-1, THP-1/ADM, K562 and K562/ADM cells.")
 Western blot was used to detect the expression of p-P70S6K, S6K, P70S6 and S6 in indicated renal tissues. (B) Immunohistochemistry of LC3 and P62 expression were assessed in rats’ kidney Downloaded from journals.physiology.org/journal/ajpendo at Univ Col London (193.060.238.225) on October 1, 2020. 29 cells samples. (C) mRNA level of mTOR and Beclin-1 was assessed using Real time PCR. The 561 levels of free radical scavenger, including SOD and GSH in blood serum’s samples of all groups were measured utilizing the Elisa kits. (D) Autophagy markers, including LC3B, P62 and Beclin-1 in indicated renal tissues were detected using western blot. NC: non-diabetic control group, n = 7; PC: diabetic control group, n = 7; INS: insulin treated group, n = 7; Saxag: saxagliptin treated group, n = 7; Lirag: liraglutide treated group, n = 9. The data are expressed as the means ± SD. vs the NC group, &P<0.05, &&P<0.01; vs the PC group, *P<0.05, **P<0.01; vs the 567 Lirag group, #P<0.05, ##P<0.01.")
 Western blot was used to detect the expression of p-P70S6K, S6K, P70S6 and S6 in indicated renal tissues. (B) Immunohistochemistry of LC3 and P62 expression were assessed in rats’ kidney Downloaded from journals.physiology.org/journal/ajpendo at Univ Col London (193.060.238.225) on October 1, 2020. 29 cells samples. (C) mRNA level of mTOR and Beclin-1 was assessed using Real time PCR. The 561 levels of free radical scavenger, including SOD and GSH in blood serum’s samples of all groups were measured utilizing the Elisa kits. (D) Autophagy markers, including LC3B, P62 and Beclin-1 in indicated renal tissues were detected using western blot. NC: non-diabetic control group, n = 7; PC: diabetic control group, n = 7; INS: insulin treated group, n = 7; Saxag: saxagliptin treated group, n = 7; Lirag: liraglutide treated group, n = 9. The data are expressed as the means ± SD. vs the NC group, &P<0.05, &&P<0.01; vs the PC group, *P<0.05, **P<0.01; vs the 567 Lirag group, #P<0.05, ##P<0.01.")

 Immunofluorescence staining of Beclin-1 and LC3B in the brain of mice. Images of the brain (left) and statistic results (right). Scale bar: 500 μm
(B) Immunofluorescence staining of Beclin-1 and LC3B in the lung of mice. Images of the lung (left) and statistic results (right). Scale bar: 500 μm
(C) The expression of LC3B and VP1 in the brain. Scale bar: 50 μm
(D) The expression of LC3B and VP1 in the lung. Scale bar: 50 μm
(E) The expression of Beclin-1 and LC3B in the brain.
(F) The expression of Beclin-1 and LC3B in the lung of mice.
NC: normal control group; EV71: Enterovirus 71 infected group; NC: n = 10; EV71: n = 10; *P < 0.05; **P < 0.01.")
 The expression of LC3β, HO-1, Beclin-1, p-AMPK, p62, p-mTOR detected by Western blot. (B-G) Statistical analysis on LC3β, HO-1, Beclin-1, p-AMPK, p62, p-mTOR. Immunohistochemical image of LC3β (H) measured by immunohistochemical analysis (400×, brown yellow granules indicate positive reaction). Data are expressed as the mean ± SD of three independent experiments. #P < 0.05, ##P < 0.01, ###P < 0.001 compare the control group; *P < 0.05 and **P < 0.01 compare model group. LDOP-L stood for LDOP-1-L, LDOP-H stood for LDOP-1-H.")
 The expression of LC3β, HO-1, Beclin-1, p-AMPK, p62, p-mTOR detected by Western blot. (B-G) Statistical analysis on LC3β, HO-1, Beclin-1, p-AMPK, p62, p-mTOR. Immunohistochemical image of LC3β (H) measured by immunohistochemical analysis (400×, brown yellow granules indicate positive reaction). Data are expressed as the mean ± SD of three independent experiments. #P < 0.05, ##P < 0.01, ###P < 0.001 compare the control group; *P < 0.05 and **P < 0.01 compare model group. LDOP-L stood for LDOP-1-L, LDOP-H stood for LDOP-1-H.")
 The expression of LC3β at the ethanol at concentrations of 2 %, 4 %, 6 %, 8 %. (B) The expression of LC3β for 0.5 h, 1 h, 1.5 h. (C) Immunofluorescence image of LC3β measured by immunofluorescence technique (GES-1 were treated with 8% ethanol for 2 h after pretreatment with LDOP-1). Data are expressed as the mean ± SD of three independent experiments. *P < 0.05 and **P < 0.01 compare to 2 % concentrations ethanol or 0.5 h group. LDOP stood for LDOP-1.")
. B, Detection of the autophagy-related proteins LC3II/I, Beclin1, AKT, PTEN, mTOR and STX3 by Western blotting.C, Immunohistochemical analysis (magnification, 200×).")
 To confrm that the efect of baicalin is mediated by regulating autophagy, 3-MA was used with baicalin treatment, and the levels of the autophagy-related proteins LC3II/I, Beclin1, P62, p-AMPK, AMPK, and mTOR were measured by Western blotting.")

 Autophagy inhibition was observed by immunofluorescence microscopy (blue fluorescence indicates Hoechst and green fluorescence indicates LC3B puncta) after HCQ (IC50) treatment for 24 h. (B) Autophagy flux was inhibited in both cell lines after HCQ treatment. (C) ROS levels of HuCCT-1 and CCLP-1 cells treated with HCQ were determined by FCM. (D) Expression of Beclin-1, LC3B, and SQSTM1/P62 proteins was detected by western blotting in HuCCT-1 and CCLP-1 cells treated with IC50 and 2*IC50 concentrations of HCQ. (E) Quantification of LC3B and SQSTM1/P62 proteins. Data are expressed as mean ± SD. **p < 0.01, ****p < 0.0001, significant difference compared with the control group.")
, (b) Western blotting image of p-mTOR, mTOR and p62 in PC12 cells at control and HGP. c Immunofluorescence staining of ATG7 in PC12 cells at control and HGP. d Immunofluorescence staining of p62 in PCNs. Scale bar, 25 μm. e, f Detection of autophagy flux in PC12 cells under the treatment of BafA1(50 nmol,4 h). Data are mean ± SD. n = 3 independent experiments for (a), (b), (d), (e) and (f), n = 4 independent experiments for (c). *p < 0.05, **p < 0.01, ***p < 0.001, ****p < 0.0001. Unpaired t test for (a), (b) and (c), two-way ANOVA for (e) and (f)")
 HaCaT cells of control, UVB and/or SAL were stained with LC3-II antibody (green, ×200). (B) SAL significantly increases the number of cells with LC3-II dots. (C) Representative blots of autophagy-related proteins by Western blot analysis. SAL significantly increases the protein expression of Beclin-1 (D), ATG7 (E) and decreases the protein expression of P62 (F). Data are shown as the mean ± SD of three independent experiments. *P<0.05, **P<0.01, ***P<0.001 vs control group; ###P<0.001 vs UVB group.")
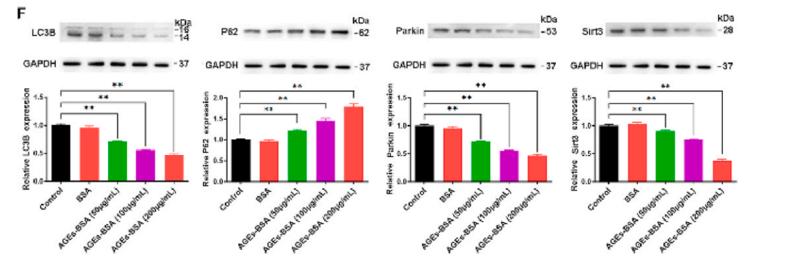
 SIRT3 and Parkin levels in OA cells were detected using western blotting. (D) Difference in Parkin fluorescent signal in mitochondria were assessed using confocal microscopy. (E) Differences in LC3B expression among different treatment groups were detected via immunofluorescence. (F–K) Cell apoptosis, ROS, and membrane potential were detected via flow cytometry. All data are presented as mean ± standard deviation. ***p < 0.001, **p < 0.01, and *p < 0.05 represent differences between groups, as determined using a one-way analysis of variance.(a), (b).")
, p62 (B), and LC3(C) were captured under fluorescence microscopy, and the relative fluorescence intensity was calculated. All images were obtained at identical magnification, ×200, scale bar = 50 μm. Data are represented as mean ± SEM (n = 3). **P")
 Immunoblotting analysis of geminin protein levels in A2780 cells as indicated. shNC, A2780 cells transfected with shNC; sh-GMNN, geminin-knockout A2780 cells transfected with shRNA. Quantification of three independent experiments was performed, normalized to tubulin, and expressed as a ratio of NC, mean ± SEM, Student’s unpaired t-test, ***p < 0.001. (B) IB analysis of apoptosis-related proteins’ expression levels in A2780 cells as indicated. Mean ± SEM, n = 3, Student’s unpaired t-test, **p < 0.01, ***p < 0.001, ns—non-significant. (C) Apoptosis analysis of A2780 cells under geminin depletion. The percentage of apoptotic cells was analyzed with flow cytometry. Mean ± SEM, n = 3, Student’s unpaired t-test, ***p < 0.001. (D) Representative phase-contrast images of bioreactor expanded A2780 cells at indicated days of cultivation. Scale bar 20 μm. (E) Graphical illustration of the average aggregate size measured at the indicated day of cultivation: Day 8, shNC n = 116, sh-GMNN n = 108; Day 16, shNC n = 130, sh-GMNN n = 161. Images were analyzed using Nikon NIS Elements D software, mean ± SD, Student’s unpaired t-test, ***p < 0.001. (F) The protein–protein associations about geminin protein. Data from STRING. (G) ROS analysis of A2780 cells under geminin depletion. The percentage of apoptosis cells was analyzed with flow cytometry. Mean ± SEM, n = 3, Student’s unpaired t-test, ***p < 0.001. (H) IB analysis of LC3B protein levels in A2780 cells as indicated. Mean ± SEM, n = 3, Student’s unpaired t-test, ***p < 0.001.")
 HEK−293T cells were transfected with PPRV−N expression plasmid or treated with rapamycin for 48 h. The LC3−II levels in the cells treated with or not treated with chloroquine were compared between control cells and either PPRV−N−expressing cells or rapamycin-treated cells. Corresponding graphs depict the levels of SQSTM1/p62 (B,C) and LC3B−II (D,E). (F): The line graph showing the comparison between SQSTM1/p62 and LC3B−II, in the absence and presence of chloroquine. (G): HEK−293T cells were pretreated with wortmannin for 6 h and transfected with PPRV−N expression plasmid for 48 h. The LC3B conversion and SQSTM1/p62 levels were compared both in the presence and absence of chloroquine between mock transfected and PPRV−N−transfected cells. Corresponding graphs depict the levels of SQSTM1/p62 (H,I) and LC3B−II (J,K). (L): The line graph showing the comparison between SQSTM1/p62 and LC3B−II in the absence and presence of wortmannin. GAPDH was used as the internal loading control. Antibodies against SQSTM1/p62 and LC3B were used in immunoblotting analysis. The data represents the mean ± SD of three independent experiments. Paired Student’s t-test was used to determine the significance. *** p < 0.0005, ** p < 0.005, * p < 0.05; ns: non-significant.")
 Observation of autophagosome by transmission electron microscope; (B) Autophagy-related protein in MCAO/R rats (WB); (C-D) Expression of P62 and LC3II/I proteins in MCAO/R rats; (E) Autophagy-related protein in OGD/R PC12 cells; (F-G) Expression of P62 and LC3II/I proteins in OGD/R PC12 cells. (n = 3, ###P < 0.001 vs Sham; ##P < 0.01 vs Sham or Control; *P < 0.05 vs OGD/R; **P < 0.01 vs Model or OGD/R).")
 Effects of TFA on mRNA expression of genes related to lipid metabolism in mice liver. (B) Effects of TFA on mRNA expression of genes related to autophagy in mice liver. (C) Protein expression of IL-6 and TNF-α in mice liver. (D) Protein expression of p-PI3K, PI3K, p-AKT, AKT, p-mTOR, mTOR, LC-3B, and p62. (E) Relative protein quantification of IL-6. (F) Relative protein quantification of TNF-α. (G) Relative protein quantification of p-PI3K/PI3K. (H) Relative protein quantification of p-AKT/AKT. (I) Relative protein quantification of p-mTOR/mTOR. (J) Relative protein quantification of p62. (K) Relative protein quantification of LC3BII/I.")
 Autophagy induction was observed by immunofluorescence microscopy after MLN2238 treatment for 24 h (Red arrows points to LC3B puncta). (B) The protein expression levels of LC3B and P62 after treatment with IC50 and 2×IC50 concentration of MLN2238 were analyzed via Western Blots. (C) Ad-mCherry-GFP-LC3 was used to estimate the autophagy flux after MLN2238 treatment in iCCA cells. (D) Cell counting kit-8 analysis and (E) flow cytometry analysis was performed to evaluated the cell viability after treatment with MLN2238 and autophagic inhibitor (chloroquine). (F) The quantitative apoptosis rates of HuCCT-1 and CCLP-1 cells are presented via histogram.")
 Nrf2, SQSTM1/p62, and LC3B; (B) STAT3, c-Myc; (C) NF-κB, NLRP3, Calmodulin in RAW264.7 cells using Western blotting. (D) Quantitative analysis of Nrf2 (n = 3). (E) Quantitative analysis of SQSTM1/p62 (n = 3). (F) Quantitative analysis of LC3B (n = 3). (G) Quantitative analysis of p-STAT3/STAT3 (n = 3). (H) Quantitative analysis of c-Myc (n = 3). RAW264.7 cells were pretreated with PI for 6 h and then exposed to LPS and IFN-γ for 3 h. *** p < 0.001 and * p < 0.05 as compared to the LPS and IFN-γ group; ### p < 0.001 and # p < 0.05 as compared to the control group.")
 TEM for observation of autophagic lysosomes. Red arrows represent the lysosomes. (B) WB for detection of autophagy markers Beclin-1, LC3II/LC3I, and p62. (C) Immunohistochemical for detection of autophagy markers Beclin-1, LC3II/LC3I, and p62. Ade, Adenosine addition group.")
 Immunoblots for proteins related to adipocyte differentiation, autophagy, and lipid accumulation. Representative blots are shown. (B) The bar graph represents protein band density. Data are mean ± SD and reported as percentage change compared to the control. n=3. Statistical analysis was performed using one-way ANOVA with Tukey’s post hoc test. *P")
| Product: | LC3B Antibody |
| Catalog: | AF4650 |
| Description: | Rabbit polyclonal antibody to LC3B |
| Application: | WB IHC IF/ICC |
| Cited expt.: | WB, IHC, IF/ICC |
| Reactivity: | Human, Mouse, Rat |
| Prediction: | Pig, Zebrafish, Bovine, Sheep, Dog, Xenopus |
| Mol.Wt.: | 14kDa,16kDa(Observed); 15kD(Calculated). |
| Uniprot: | Q9GZQ8 |
| RRID: | AB_2844592 |
Control Products
Related Downloads
Protocols
Product Info
*The optimal dilutions should be determined by the end user. For optimal experimental results, antibody reuse is not recommended.
*Tips:
WB: For western blot detection of denatured protein samples. IHC: For immunohistochemical detection of paraffin sections (IHC-p) or frozen sections (IHC-f) of tissue samples. IF/ICC: For immunofluorescence detection of cell samples. ELISA(peptide): For ELISA detection of antigenic peptide.
Cite Format: Affinity Biosciences Cat# AF4650, RRID:AB_2844592.
Fold/Unfold
ATG8F; Autophagy-related protein LC3 B; Autophagy-related ubiquitin-like modifier LC3 B; LC3B; LC3II; MAP1 light chain 3 like protein 2; MAP1 light chain 3-like protein 2; MAP1A/1BLC3; MAP1A/MAP1B LC3 B; MAP1A/MAP1B light chain 3 B; MAP1ALC3; MAP1LC3B a; Map1lc3b; Microtubule associated protein 1 light chain 3 beta; Microtubule-associated protein 1 light chain 3 beta; Microtubule-associated proteins 1A/1B light chain 3B; MLP3B_HUMAN;
Immunogens
A synthesized peptide derived from human LC3B, corresponding to a region within N-terminal amino acids.
Most abundant in heart, brain, skeletal muscle and testis. Little expression observed in liver.
- Q9GZQ8 MLP3B_HUMAN:
- Protein BLAST With
- NCBI/
- ExPASy/
- Uniprot
MPSEKTFKQRRTFEQRVEDVRLIREQHPTKIPVIIERYKGEKQLPVLDKTKFLVPDHVNMSELIKIIRRRLQLNANQAFFLLVNGHSMVSVSTPISEVYESEKDEDGFLYMVYASQETFGMKLSV
Predictions
Score>80(red) has high confidence and is suggested to be used for WB detection. *The prediction model is mainly based on the alignment of immunogen sequences, the results are for reference only, not as the basis of quality assurance.
High(score>80) Medium(80>score>50) Low(score<50) No confidence
Research Backgrounds
Ubiquitin-like modifier involved in formation of autophagosomal vacuoles (autophagosomes). Plays a role in mitophagy which contributes to regulate mitochondrial quantity and quality by eliminating the mitochondria to a basal level to fulfill cellular energy requirements and preventing excess ROS production. Whereas LC3s are involved in elongation of the phagophore membrane, the GABARAP/GATE-16 subfamily is essential for a later stage in autophagosome maturation. Promotes primary ciliogenesis by removing OFD1 from centriolar satellites via the autophagic pathway. Through its interaction with the reticulophagy receptor TEX264, paticipates in the remodeling of subdomains of the endoplasmic reticulum into autophagosomes upon nutrient stress, which then fuse with lysosomes for endoplasmic reticulum turnover.
The precursor molecule is cleaved by ATG4B to form the cytosolic form, LC3-I. This is activated by APG7L/ATG7, transferred to ATG3 and conjugated to phospholipid to form the membrane-bound form, LC3-II.
The Legionella effector RavZ is a deconjugating enzyme that produces an ATG8 product that would be resistant to reconjugation by the host machinery due to the cleavage of the reactive C-terminal glycine.
Phosphorylation at Thr-12 by PKA inhibits conjugation to phosphatidylethanolamine (PE) (By similarity). Interaction with MAPK15 reduces the inhibitory phosphorylation and increases autophagy activity.
Cytoplasm>Cytoskeleton. Endomembrane system>Lipid-anchor. Cytoplasmic vesicle>Autophagosome membrane>Lipid-anchor. Cytoplasmic vesicle>Autophagosome.
Note: LC3-II binds to the autophagic membranes. Localizes also to discrete punctae along the ciliary axoneme (By similarity).
Most abundant in heart, brain, skeletal muscle and testis. Little expression observed in liver.
Belongs to the ATG8 family.
Research Fields
· Cellular Processes > Cell growth and death > Ferroptosis. (View pathway)
References

Application: WB Species: human Sample: NP cells

Application: IF/ICC Species: human Sample: NP cells
Application: WB Species: mice Sample: bone marrow mesenchymal stem (BMSCs)
Restrictive clause
Affinity Biosciences tests all products strictly. Citations are provided as a resource for additional applications that have not been validated by Affinity Biosciences. Please choose the appropriate format for each application and consult Materials and Methods sections for additional details about the use of any product in these publications.
For Research Use Only.
Not for use in diagnostic or therapeutic procedures. Not for resale. Not for distribution without written consent. Affinity Biosciences will not be held responsible for patent infringement or other violations that may occur with the use of our products. Affinity Biosciences, Affinity Biosciences Logo and all other trademarks are the property of Affinity Biosciences LTD.