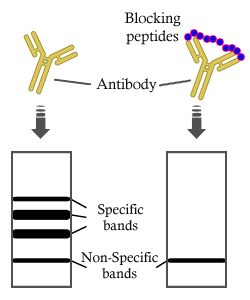
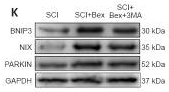
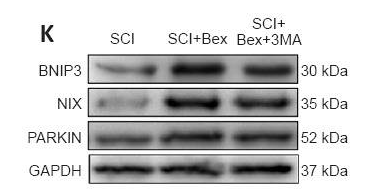
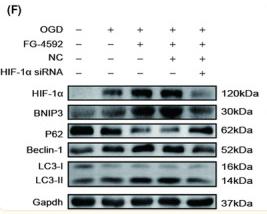
Product: BNIP3 Antibody
Catalog: DF8188
Description: Rabbit polyclonal antibody to BNIP3
Application: WB
Reactivity: Human, Mouse, Rat
Prediction: Pig, Bovine, Horse, Sheep, Rabbit, Dog, Chicken, Xenopus
Mol.Wt.: 30 kDa; 28kD(Calculated).
Uniprot: Q12983
RRID: AB_2841498

View similar products>>

   Size Price Inventory
 100ul $280 In stock
 200ul $350 In stock

Lead Time: Same day delivery

For pricing and ordering contact:
Local distributors

Product Info

Source:
Rabbit
Application:
WB 1:1000-3000
*The optimal dilutions should be determined by the end user.
*Tips:

WB: For western blot detection of denatured protein samples. IHC: For immunohistochemical detection of paraffin sections (IHC-p) or frozen sections (IHC-f) of tissue samples. IF/ICC: For immunofluorescence detection of cell samples. ELISA(peptide): For ELISA detection of antigenic peptide.

Reactivity:
Human,Mouse,Rat
Prediction:
Pig(100%), Bovine(100%), Horse(100%), Sheep(87%), Rabbit(100%), Dog(100%), Chicken(93%), Xenopus(93%)
Clonality:
Polyclonal
Specificity:
BNIP3 Antibody detects endogenous levels of total BNIP3.
RRID:
AB_2841498
Cite Format: Affinity Biosciences Cat# DF8188, RRID:AB_2841498.
Conjugate:
Unconjugated.
Purification:
The antiserum was purified by peptide affinity chromatography using SulfoLink™ Coupling Resin (Thermo Fisher Scientific).
Storage:
Rabbit IgG in phosphate buffered saline , pH 7.4, 150mM NaCl, 0.02% sodium azide and 50% glycerol. Store at -20 °C. Stable for 12 months from date of receipt.
Alias:

Fold/Unfold

BCL2 Adenovirus E1B 19kDa Interacting Protein 3; BCL2/adenovirus E1B 19 kDa protein interacting protein 3; BCL2/adenovirus E1B 19 kDa protein-interacting protein 3; BNIP 3; BNIP3; BNIP3_HUMAN; NIP 3; NIP3;

Immunogens

Immunogen:
Uniprot:
Gene(ID):
Sequence:
MGDAAADPPGPALPCEFLRPGCGAPLSPGAQLGRGAPTSAFPPPAAEAHPAARRGLRSPQLPSGAMSQNGAPGMQEESLQGSWVELHFSNNGNGGSVPASVSIYNGDMEKILLDAQHESGRSSSKSSHCDSPPRSQTPQDTNRASETDTHSIGEKNSSQSEEDDIERRKEVESILKKNSDWIWDWSSRPENIPPKEFLFKHPKRTATLSMRNTSVMKKGGIFSAEFLKVFLPSLLLSHLLAIGLGIYIGRRLTTSTSTF

Predictions

Predictions:

Score>80(red) has high confidence and is suggested to be used for WB detection. *The prediction model is mainly based on the alignment of immunogen sequences, the results are for reference only, not as the basis of quality assurance.

Species
Results
Score
Pig
100
Horse
100
Bovine
100
Dog
100
Rabbit
100
Xenopus
93
Chicken
93
Sheep
87
Zebrafish
0
Model Confidence:
High(score>80) Medium(80>score>50) Low(score<50) No confidence

PTMs - Q12983 As Substrate

Site PTM Type Enzyme
S82 Phosphorylation
S89 Phosphorylation
Y104 Phosphorylation
S119 Phosphorylation
S127 Phosphorylation
S131 Phosphorylation
T137 Phosphorylation
T147 Phosphorylation
S151 Phosphorylation
K155 Ubiquitination
S157 Phosphorylation
S158 Phosphorylation
S160 Phosphorylation
K169 Ubiquitination
K176 Ubiquitination
K195 Ubiquitination
K200 Ubiquitination
R204 Methylation
T205 Phosphorylation
S209 Phosphorylation
T213 Phosphorylation
S214 Phosphorylation
K218 Ubiquitination
T253 Phosphorylation
T254 Phosphorylation
S255 Phosphorylation
T256 Phosphorylation
S257 Phosphorylation
T258 Phosphorylation

Research Backgrounds

Function:

Apoptosis-inducing protein that can overcome BCL2 suppression. May play a role in repartitioning calcium between the two major intracellular calcium stores in association with BCL2. Involved in mitochondrial quality control via its interaction with SPATA18/MIEAP: in response to mitochondrial damage, participates in mitochondrial protein catabolic process (also named MALM) leading to the degradation of damaged proteins inside mitochondria. The physical interaction of SPATA18/MIEAP, BNIP3 and BNIP3L/NIX at the mitochondrial outer membrane regulates the opening of a pore in the mitochondrial double membrane in order to mediate the translocation of lysosomal proteins from the cytoplasm to the mitochondrial matrix. Plays an important role in the calprotectin (S100A8/A9)-induced cell death pathway.

Subcellular Location:

Mitochondrion. Mitochondrion outer membrane>Single-pass membrane protein.
Note: Coexpression with the EIB 19-kDa protein results in a shift in NIP3 localization pattern to the nuclear envelope. Colocalizes with ACAA2 in the mitochondria. Colocalizes with SPATA18 at the mitochondrion outer membrane.

Extracellular region or secreted Cytosol Plasma membrane Cytoskeleton Lysosome Endosome Peroxisome ER Golgi apparatus Nucleus Mitochondrion Manual annotation Automatic computational assertionSubcellular location
Subunit Structure:

Homodimer. Binds to BCL2. Interacts with BNIP3L and ACAA2. Interacts (via BH3 domain) with SPATA18 (via coiled-coil domains). Interacts with BOK; promotes BOK oligomerization.

(Microbial infection) Interacts with adenovirus E1B 19 kDa protein.

(Microbial infection) Interacts with Epstein-Barr virus BHRF1.

Family&Domains:

Belongs to the NIP3 family.

Research Fields

· Cellular Processes > Transport and catabolism > Autophagy - animal.   (View pathway)

· Environmental Information Processing > Signal transduction > FoxO signaling pathway.   (View pathway)

· Human Diseases > Infectious diseases: Bacterial > Legionellosis.

References

1). Integrating network analysis and experimental validation to reveal the mitophagy-associated mechanism of Yiqi Huoxue (YQHX) prescription in the treatment of myocardial ischemia/reperfusion injury. PHARMACOLOGICAL RESEARCH (PubMed: 36736970) [IF=9.3]

2). Betulinic Acid Inhibits ROS-Mediated Pyroptosis in Spinal Cord Injury by Augmenting Autophagy via the AMPK-mTOR-TFEB Signaling Pathway. International Journal of Biological Sciences (PubMed: 33867836) [IF=9.2]

Application: WB    Species: Mice    Sample: spinal cords

Figure 7 BA activates autophagy and mitophagy via enhancing AMPK-mTOR -TFEB activity. (A) Western blotting for AMPK, p-AMPK, mTOR and p-mTOR expression levels, and TFEB nuclear translocation in the Sham, SCI and BA groups. The gels were run under the same experimental conditions, and the cropped blots are shown here. (B) The optical density values of the AMPK, p-AMPK, mTOR, p-mTOR, normalized to the loading control GAPDH; Densitometric analysis of TFEB, normalized to the loading control H3. (C) Western blotting for AMPK, p-AMPK, mTOR and p-mTOR expression levels, and TFEB nuclear translocation in the BA and BA+3MA groups. The gels were run under the same experimental conditions, and the cropped blots are shown here. (D) The optical density values of the AMPK, p-AMPK, mTOR, p-mTOR, normalized to the loading control GAPDH; Densitometric analysis of TFEB, normalized to the loading control H3. (E) Western blotting for Caspase-1, NLRP3, GSDMD, p62, LC3II, Bnip3, Nix and Parkin expression levels in the BA and BA+CC groups. The gels were run under the same experimental conditions, and the cropped blots are shown here. (F) The optical density values of the Caspase-1, NLRP3, GSDMD, p62, LC3II, Bnip3, Nix and Parkin expression levels, normalized to the loading control GAPDH. The values are expressed as the means ± SEM, n=5 per group. *p< 0.05 and **p< 0.01, vs. Sham group. #p< 0.05 and ##p< 0.01, vs. SCI group. &p< 0.05 and &&p< 0.01, vs. BA group.

Application: WB    Species: Mice    Sample: spinal cords

Figure 6 BA attenuates mitophagy and reduces ROS accumulation after SCI. (A) ELISA of 8-OHdG, AOPP, and MDA in spinal cord lesions from Sham, SCI, BA and BA+3MA groups as indicated. (B) Immunofluorescence staining for Nix and NeuN co-localization in the spinal cords of the Sham, SCI, BA and BA+3MA groups (scale bar = 25 µm). (C) The quantitative mean optical density of the Nix in motor neurons of spinal cord lesion in each group. (D) Western blotting for Bnip3, Nix and Parkin expression levels in the Sham, SCI and BA groups. The gels were run under the same experimental conditions, and the cropped blots are shown here. (E) The optical density values of the Bnip3, Nix and Parkin expression levels were quantified and analyzed in the three groups. (F) Western blotting for Bnip3, Nix and Parkin expression levels in the BA and BA+3MA groups. The gels were run under the same experimental conditions, and the cropped blots are shown here. (G) The optical density values of the Bnip3, Nix and Parkin expression levels were quantified and analyzed in the both groups. The values are expressed as the means ± SEM, n=5 per group. *p< 0.05 and **p< 0.01, vs. Sham group. #p< 0.05 and ##p< 0.01, vs. SCI group. &p< 0.05 and &&p< 0.01, vs. BA group.

3). A classical herbal formula alleviates high-fat diet induced nonalcoholic steatohepatitis (NASH) via targeting mitophagy to rehabilitate dysfunctional mitochondria, validated by UPLC-HRMS identification combined with in vivo experiment. Biomedicine & pharmacotherapy = Biomedecine & pharmacotherapie (PubMed: 37939615) [IF=7.5]

Application: WB    Species: Mouse    Sample:

Fig. 9. Effects of SG formula on predicted targets expression of HFD induced - NASH model. (A-F) Representative western blot images and bar graphs of the relative expressions of BNIP3, BNIP3L, LC3BI, LC3BII and p62 in each group. * , * *, and * ** represent P 

4). Acute nitrite exposure-induced oxidative damage, endoplasmic reticulum stress, autophagy and apoptosis caused gill tissue damage of grass carp (Ctenopharyngodon idella): Relieved by dietary protein. ECOTOXICOLOGY AND ENVIRONMENTAL SAFETY (PubMed: 35994904) [IF=6.8]

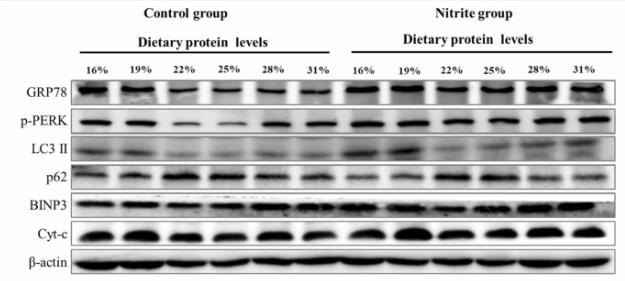
Application: WB    Species: Fish    Sample: gill tissue

Fig. 5. Changes in related protein levels in grass carp gill fed with different protein levels and exposed to nitrite for 96 h. Data represent the means of each group. Treatment 1 of the control group was used as a reference. NS: not significant.

5). Bexarotene improves motor function after spinal cord injury in mice. Neural Regeneration Research (PubMed: 37449638) [IF=6.1]

Application: WB    Species: Mouse    Sample: spinal cord

Figure 6 Bexarotene promotes mitophagy and decreases ROS levels after SCI. (A) Immunofluorescence staining for GSDMD (pyroptosis-related marker, green), C-CASP1 (pyroptosis-related marker, red), NIX (mitophagy-related marker, red) and DHE (indicating ROS-positive cells, red) in neurons in the spinal cord (original magnification 30×). Scale bar: 25 μm. (B–E) Quantitative analysis of levels of GSDMD (B), C-CASP1 (C), NIX (D) and DHE (E) in A. (F–H) The levels of 8-OHdG and AOPP in the spinal cord were detected by ELISA, and the levels of MDA were detected by the thiobarbituric acid assay. (I, L) Western blot assay for pyroptosis-related and mitophagy-related proteins. Data were normalized to GAPDH. (M) The levels of mitophagy-related genes in the spinal cord were detected by qPCR and normalized to β-actin. Data are expressed as the mean ± SEM (n = 6 mice per group). *P < 0.05 and **P < 0.01, vs. SCI group; #P < 0.05 and ##P < 0.01, vs. SCI + Bex group (one-way analysis of variance with the least significance difference post hoc test). ASC: Apoptosis-associated speck-like protein containing a CARD; Bex: bexarotene; BNIP3: BCL2/adenovirus E1B 19 kDa interacting protein 3; C-CASP-1: cleaved Caspase 1; DAPI: 4′,6-diamidino-2-phenylindole; DHE: dihydroethidium; ELISA: enzyme-linked immunosorbent assay; GAPDH: glyceraldehyde-3-phosphate dehydrogenase; GSDMD-N: gasdermin D-N; IOD: integrated optical density; MDA: malondialdehyde; NIX/BNIP3L: BCL2/adenovirus E1B 19 kDa interacting protein 3 like; NLRP3: NOD-like receptor thermal protein domain associated protein 3; SCI: spinal cord injury.

6). 贝沙罗汀改善脊髓损伤后运动功能的机制. 中国神经再生研究(英文版) (PubMed: 37449638) [IF=6.1]

Application: WB    Species: Mouse    Sample:

Figure 6 Bexarotene promotes mitophagy and decreases ROS levels after SCI. (A) Immunofluorescence staining for GSDMD (pyroptosis-related marker, green), C-CASP1 (pyroptosis-related marker, red), NIX (mitophagy-related marker, red) and DHE (indicating ROS-positive cells, red) in neurons in the spinal cord (original magnification 30×). Scale bar: 25 μm. (B–E) Quantitative analysis of levels of GSDMD (B), C-CASP1 (C), NIX (D) and DHE (E) in A. (F–H) The levels of 8-OHdG and AOPP in the spinal cord were detected by ELISA, and the levels of MDA were detected by the thiobarbituric acid assay. (I, L) Western blot assay for pyroptosis-related and mitophagy-related proteins. Data were normalized to GAPDH. (M) The levels of mitophagy-related genes in the spinal cord were detected by qPCR and normalized to β-actin. Data are expressed as the mean ± SEM (n = 6 mice per group). *P < 0.05 and **P < 0.01, vs. SCI group; #P < 0.05 and ##P < 0.01, vs. SCI + Bex group (one-way analysis of variance with the least significance difference post hoc test). ASC: Apoptosis-associated speck-like protein containing a CARD; Bex: bexarotene; BNIP3: BCL2/adenovirus E1B 19 kDa interacting protein 3; C-CASP-1: cleaved Caspase 1; DAPI: 4′,6-diamidino-2-phenylindole; DHE: dihydroethidium; ELISA: enzyme-linked immunosorbent assay; GAPDH: glyceraldehyde-3-phosphate dehydrogenase; GSDMD-N: gasdermin D-N; IOD: integrated optical density; MDA: malondialdehyde; NIX/BNIP3L: BCL2/adenovirus E1B 19 kDa interacting protein 3 like; NLRP3: NOD-like receptor thermal protein domain associated protein 3; SCI: spinal cord injury.

7). Transplantation of Roxadustat-preconditioned bone marrow stromal cells improves neurological function recovery through enhancing grafted cell survival in ischemic stroke rats. CNS Neuroscience & Therapeutics (PubMed: 35695696) [IF=5.5]

Application: WB    Species: Rat    Sample: BMSCs

FIGURE 3 FG‐4592 inhibits apoptosis in bone marrow stromal cell (BMSC) post‐oxygen–glucose deprivation (OGD) through activating HIF‐1α/BNIP3‐dependent autophagy. (A, B) Apoptosis measured by flow cytometry (FCM), and statistics were displayed as mean ± SD. (C–E) Western blot images and relative quantification of apoptosis‐related proteins (Bcl‐2, Bax) and Gapdh (n = 4). (F–K) Expression of HIF‐1α, BNIP3, P62, Beclin‐1, LC3, and Gapdh in BMSCs was detected by western blot. And relative quantification of HIF‐1α, BNIP3, P62, Beclin‐1, LC3 (n = 4). * means p value <0.05, ** means p value <0.01, and *** means p value <0.001; n.s. means no significance, p values were calculated with one‐way ANOVA, followed by Bonferroni's multiple comparison test

Restrictive clause


Affinity Biosciences tests all products strictly. Citations are provided as a resource for additional applications that have not been validated by Affinity Biosciences. Please choose the appropriate format for each application and consult Materials and Methods sections for additional details about the use of any product in these publications.

For Research Use Only.
Not for use in diagnostic or therapeutic procedures. Not for resale. Not for distribution without written consent. Affinity Biosciences will not be held responsible for patent infringement or other violations that may occur with the use of our products. Affinity Biosciences, Affinity Biosciences Logo and all other trademarks are the property of Affinity Biosciences LTD.