, using XDH Antibody at 1/1000 dilution.")

| Product: | XDH Antibody |
| Catalog: | DF8111 |
| Description: | Rabbit polyclonal antibody to XDH |
| Application: | WB IHC |
| Cited expt.: | WB, IHC |
| Reactivity: | Human, Rat |
| Prediction: | Pig, Bovine, Sheep, Rabbit, Dog, Chicken |
| Mol.Wt.: | 146 kDa(Observed); 146kD(Calculated). |
| Uniprot: | P47989 |
| RRID: | AB_2841454 |
Control Products
Related Downloads
Protocols
Product Info
*The optimal dilutions should be determined by the end user. For optimal experimental results, antibody reuse is not recommended.
*Tips:
WB: For western blot detection of denatured protein samples. IHC: For immunohistochemical detection of paraffin sections (IHC-p) or frozen sections (IHC-f) of tissue samples. IF/ICC: For immunofluorescence detection of cell samples. ELISA(peptide): For ELISA detection of antigenic peptide.
Cite Format: Affinity Biosciences Cat# DF8111, RRID:AB_2841454.
Fold/Unfold
Xanthine dehydrogenase; Xanthine dehydrogenase/oxidase; Xanthine oxidase; Xanthine oxidoreductase; XD; XDH; XDH_HUMAN; xdha; XO; xor;
Immunogens
A synthesized peptide derived from human XDH, corresponding to a region within the internal amino acids.
- P47989 XDH_HUMAN:
- Protein BLAST With
- NCBI/
- ExPASy/
- Uniprot
MTADKLVFFVNGRKVVEKNADPETTLLAYLRRKLGLSGTKLGCGEGGCGACTVMLSKYDRLQNKIVHFSANACLAPICSLHHVAVTTVEGIGSTKTRLHPVQERIAKSHGSQCGFCTPGIVMSMYTLLRNQPEPTMEEIENAFQGNLCRCTGYRPILQGFRTFARDGGCCGGDGNNPNCCMNQKKDHSVSLSPSLFKPEEFTPLDPTQEPIFPPELLRLKDTPRKQLRFEGERVTWIQASTLKELLDLKAQHPDAKLVVGNTEIGIEMKFKNMLFPMIVCPAWIPELNSVEHGPDGISFGAACPLSIVEKTLVDAVAKLPAQKTEVFRGVLEQLRWFAGKQVKSVASVGGNIITASPISDLNPVFMASGAKLTLVSRGTRRTVQMDHTFFPGYRKTLLSPEEILLSIEIPYSREGEYFSAFKQASRREDDIAKVTSGMRVLFKPGTTEVQELALCYGGMANRTISALKTTQRQLSKLWKEELLQDVCAGLAEELHLPPDAPGGMVDFRCTLTLSFFFKFYLTVLQKLGQENLEDKCGKLDPTFASATLLFQKDPPADVQLFQEVPKGQSEEDMVGRPLPHLAADMQASGEAVYCDDIPRYENELSLRLVTSTRAHAKIKSIDTSEAKKVPGFVCFISADDVPGSNITGICNDETVFAKDKVTCVGHIIGAVVADTPEHTQRAAQGVKITYEELPAIITIEDAIKNNSFYGPELKIEKGDLKKGFSEADNVVSGEIYIGGQEHFYLETHCTIAVPKGEAGEMELFVSTQNTMKTQSFVAKMLGVPANRIVVRVKRMGGGFGGKETRSTVVSTAVALAAYKTGRPVRCMLDRDEDMLITGGRHPFLARYKVGFMKTGTVVALEVDHFSNVGNTQDLSQSIMERALFHMDNCYKIPNIRGTGRLCKTNLPSNTAFRGFGGPQGMLIAECWMSEVAVTCGMPAEEVRRKNLYKEGDLTHFNQKLEGFTLPRCWEECLASSQYHARKSEVDKFNKENCWKKRGLCIIPTKFGISFTVPFLNQAGALLHVYTDGSVLLTHGGTEMGQGLHTKMVQVASRALKIPTSKIYISETSTNTVPNTSPTAASVSADLNGQAVYAACQTILKRLEPYKKKNPSGSWEDWVTAAYMDTVSLSATGFYRTPNLGYSFETNSGNPFHYFSYGVACSEVEIDCLTGDHKNLRTDIVMDVGSSLNPAIDIGQVEGAFVQGLGLFTLEELHYSPEGSLHTRGPSTYKIPAFGSIPIEFRVSLLRDCPNKKAIYASKAVGEPPLFLAASIFFAIKDAIRAARAQHTGNNVKELFRLDSPATPEKIRNACVDKFTTLCVTGVPENCKPWSVRV
Predictions
Score>80(red) has high confidence and is suggested to be used for WB detection. *The prediction model is mainly based on the alignment of immunogen sequences, the results are for reference only, not as the basis of quality assurance.
High(score>80) Medium(80>score>50) Low(score<50) No confidence
Research Backgrounds
Key enzyme in purine degradation. Catalyzes the oxidation of hypoxanthine to xanthine. Catalyzes the oxidation of xanthine to uric acid. Contributes to the generation of reactive oxygen species. Has also low oxidase activity towards aldehydes (in vitro).
Subject to partial proteolysis; this alters the enzyme from the dehydrogenase form (D) to the oxidase form (O).
Contains sulfhydryl groups that are easily oxidized (in vitro); this alters the enzyme from the dehydrogenase form (D) to the oxidase form (O).
Cytoplasm. Peroxisome. Secreted.
Detected in milk (at protein level).
Belongs to the xanthine dehydrogenase family.
Research Fields
· Cellular Processes > Transport and catabolism > Peroxisome. (View pathway)
· Metabolism > Nucleotide metabolism > Purine metabolism.
· Metabolism > Biosynthesis of other secondary metabolites > Caffeine metabolism.
· Metabolism > Xenobiotics biodegradation and metabolism > Drug metabolism - other enzymes.
· Metabolism > Global and overview maps > Metabolic pathways.
References
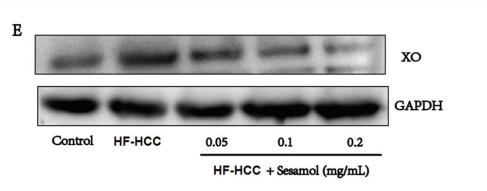
Application: WB Species: Rat Sample: liver tissue
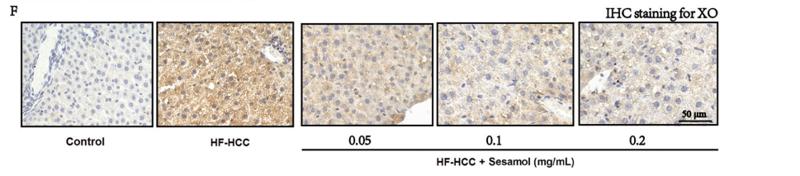
Application: IHC Species: Rat Sample: liver tissue
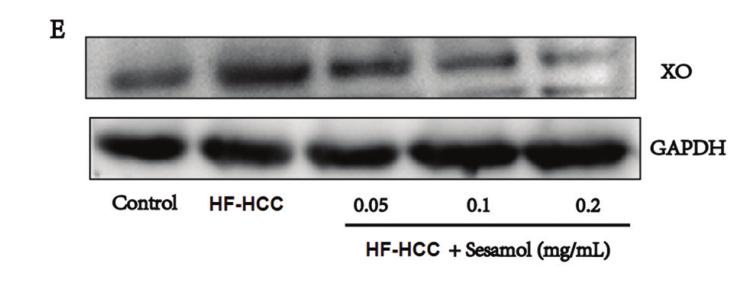
Application: WB Species: Rat Sample:

Application: WB Species: human Sample:
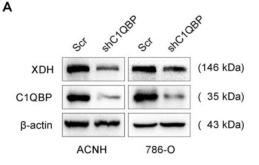
Application: WB Species: Human Sample: ACHN and 786-O cells
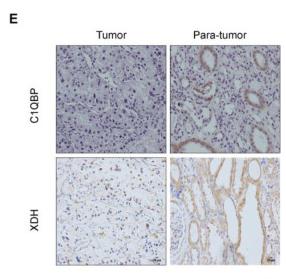
Application: IHC Species: Human Sample: kidney tissues
Restrictive clause
Affinity Biosciences tests all products strictly. Citations are provided as a resource for additional applications that have not been validated by Affinity Biosciences. Please choose the appropriate format for each application and consult Materials and Methods sections for additional details about the use of any product in these publications.
For Research Use Only.
Not for use in diagnostic or therapeutic procedures. Not for resale. Not for distribution without written consent. Affinity Biosciences will not be held responsible for patent infringement or other violations that may occur with the use of our products. Affinity Biosciences, Affinity Biosciences Logo and all other trademarks are the property of Affinity Biosciences LTD.