Product: Vimentin mouse monoclonal Antibody
Catalog: BF8006
Description: Mouse monoclonal antibody to Vimentin
Application: WB IHC IF/ICC
Reactivity: Human, Mouse, Rat
Mol.Wt.: 53kDa; 54kD(Calculated).
Uniprot: P08670
RRID: AB_2847777

View similar products>>

   Size Price Inventory
 50ul $250 In stock
 100ul $350 In stock
 200ul $450 In stock

Lead Time: Same day delivery

For pricing and ordering contact:
Local distributors

Product Info

Source:
Mouse
Application:
WB 1:500-1:3000, IHC 1:50-1:200, IF/ICC 1:100-1:500
*The optimal dilutions should be determined by the end user.
*Tips:

WB: For western blot detection of denatured protein samples. IHC: For immunohistochemical detection of paraffin sections (IHC-p) or frozen sections (IHC-f) of tissue samples. IF/ICC: For immunofluorescence detection of cell samples. ELISA(peptide): For ELISA detection of antigenic peptide.

Reactivity:
Human,Mouse,Rat
Clonality:
Monoclonal [AFfirm079]
Specificity:
Vimentin antibody detects endogenous levels of total Vimentin.
RRID:
AB_2847777
Cite Format: Affinity Biosciences Cat# BF8006, RRID:AB_2847777.
Conjugate:
Unconjugated.
Purification:
Affinity-chromatography.
Storage:
Mouse IgG1 in phosphate buffered saline (without Mg2+ and Ca2+), pH 7.4, 150mM NaCl, 0.02% sodium azide and 50% glycerol. Store at -20 °C. Stable for 12 months from date of receipt.
Alias:

Fold/Unfold

CTRCT30; Epididymis luminal protein 113; FLJ36605; HEL113; VIM; VIME_HUMAN; Vimentin;

Immunogens

Immunogen:

Purified recombinant fragment of human Vimentin expressed in E. Coli.

Uniprot:
Gene(ID):
Expression:
P08670 VIME_HUMAN:

Highly expressed in fibroblasts, some expression in T- and B-lymphocytes, and little or no expression in Burkitt's lymphoma cell lines. Expressed in many hormone-independent mammary carcinoma cell lines.

Description:
Vimentin, also know as VIM. It is the major subunit protein of the intermediate filaments of mesenchymal cells. It is believed to be involved with the intracellular transport of proteins between the nucleus and plasma membrane. Vimentin has been implicated to be involved in the rate of steroid synthesis via its role as a storage network for steroidogenic cholesterol containing lipid droplets.
Sequence:
MSTRSVSSSSYRRMFGGPGTASRPSSSRSYVTTSTRTYSLGSALRPSTSRSLYASSPGGVYATRSSAVRLRSSVPGVRLLQDSVDFSLADAINTEFKNTRTNEKVELQELNDRFANYIDKVRFLEQQNKILLAELEQLKGQGKSRLGDLYEEEMRELRRQVDQLTNDKARVEVERDNLAEDIMRLREKLQEEMLQREEAENTLQSFRQDVDNASLARLDLERKVESLQEEIAFLKKLHEEEIQELQAQIQEQHVQIDVDVSKPDLTAALRDVRQQYESVAAKNLQEAEEWYKSKFADLSEAANRNNDALRQAKQESTEYRRQVQSLTCEVDALKGTNESLERQMREMEENFAVEAANYQDTIGRLQDEIQNMKEEMARHLREYQDLLNVKMALDIEIATYRKLLEGEESRISLPLPNFSSLNLRETNLDSLPLVDTHSKRTLLIKTVETRDGQVINETSQHHDDLE

PTMs - P08670 As Substrate

Site PTM Type Enzyme
S2 Phosphorylation
T3 Phosphorylation
R4 Methylation
S5 Phosphorylation P17252 (PRKCA)
S7 O-Glycosylation
S7 Phosphorylation P17252 (PRKCA) , Q96GD4 (AURKB) , Q02156 (PRKCE) , P17612 (PRKACA)
S8 Phosphorylation P17252 (PRKCA)
S9 Phosphorylation P17252 (PRKCA)
S10 Phosphorylation P17252 (PRKCA)
Y11 Phosphorylation
R12 Methylation
R13 Methylation
T20 Phosphorylation
S22 Phosphorylation
R23 Methylation
S25 Phosphorylation P17252 (PRKCA) , Q96GD4 (AURKB) , P17612 (PRKACA)
S26 Phosphorylation Q13153 (PAK1) , P17252 (PRKCA) , Q13177 (PAK2)
S27 Phosphorylation
R28 Methylation
S29 Phosphorylation
Y30 Phosphorylation
T32 Phosphorylation
T33 O-Glycosylation
T33 Phosphorylation
S34 O-Glycosylation
S34 Phosphorylation P17252 (PRKCA)
T35 Phosphorylation
R36 Methylation
T37 Phosphorylation
Y38 Phosphorylation
S39 Phosphorylation P49137 (MAPKAPK2) , Q13177 (PAK2) , P17612 (PRKACA) , O75116 (ROCK2) , P31749 (AKT1) , Q13153 (PAK1) , Q96GD4 (AURKB) , P17252 (PRKCA)
S42 Phosphorylation P17252 (PRKCA)
R45 Methylation
S47 Phosphorylation P17612 (PRKACA) , Q96GD4 (AURKB)
T48 Phosphorylation
S49 Phosphorylation
R50 Methylation
S51 Phosphorylation Q13177 (PAK2) , Q13153 (PAK1) , P49137 (MAPKAPK2)
Y53 Phosphorylation
S55 O-Glycosylation
S55 Phosphorylation P24941 (CDK2) , P06493 (CDK1)
S56 Phosphorylation P78527 (PRKDC) , P06493 (CDK1) , P49137 (MAPKAPK2) , Q13153 (PAK1) , P24941 (CDK2) , Q00535 (CDK5)
Y61 Phosphorylation
T63 Phosphorylation
R64 Methylation
S65 Phosphorylation Q96GD4 (AURKB)
S66 Phosphorylation Q96GD4 (AURKB) , Q13177 (PAK2) , Q13153 (PAK1)
R69 Methylation
R71 Methylation
S72 Phosphorylation P17612 (PRKACA) , Q96GD4 (AURKB) , Q13464 (ROCK1) , O75116 (ROCK2)
S73 Phosphorylation Q13177 (PAK2) , Q96GD4 (AURKB) , P17612 (PRKACA) , Q13153 (PAK1)
S83 Phosphorylation Q13557 (CAMK2D) , Q9UQM7 (CAMK2A) , P49137 (MAPKAPK2) , P53350 (PLK1)
S87 Phosphorylation Q96GD4 (AURKB)
K97 Ubiquitination
T99 Phosphorylation
T101 Phosphorylation
K104 Acetylation
K104 Ubiquitination
R113 Methylation
Y117 Phosphorylation
K120 Acetylation
K120 Methylation
K120 Ubiquitination
K129 Acetylation
K129 Ubiquitination
K139 Acetylation
K139 Ubiquitination
K143 Ubiquitination
S144 Phosphorylation
Y150 Phosphorylation
R158 Methylation
K168 Acetylation
K168 Ubiquitination
R184 Methylation
K188 Ubiquitination
T202 Phosphorylation
S205 Phosphorylation
S214 Phosphorylation
K223 Ubiquitination
S226 Phosphorylation
K235 Acetylation
K235 Ubiquitination
K236 Acetylation
K236 Ubiquitination
S261 Phosphorylation
K262 Ubiquitination
T266 Phosphorylation
Y276 Phosphorylation
S278 Phosphorylation
K282 Acetylation
K282 Ubiquitination
Y291 Phosphorylation
K292 Acetylation
K292 Ubiquitination
K294 Acetylation
K294 Ubiquitination
S299 Phosphorylation
R310 Methylation
K313 Acetylation
K313 Sumoylation
K313 Ubiquitination
S316 Phosphorylation
T317 Phosphorylation
S325 Phosphorylation
T327 Phosphorylation
C328 S-Nitrosylation
K334 Acetylation
K334 Ubiquitination
T336 Phosphorylation
S339 Phosphorylation
Y358 Phosphorylation
T361 Phosphorylation
K373 Acetylation
K373 Ubiquitination
R381 Methylation
Y383 Phosphorylation
Y400 Phosphorylation
R401 Methylation
K402 Acetylation
K402 Sumoylation
K402 Ubiquitination
S409 Phosphorylation
R410 Methylation
S412 Phosphorylation
S419 Phosphorylation
S420 Phosphorylation
T426 Phosphorylation
S430 Phosphorylation P78527 (PRKDC)
T436 Phosphorylation
S438 Phosphorylation
K439 Acetylation
K439 Ubiquitination
T441 Phosphorylation
K445 Acetylation
K445 Methylation
K445 Sumoylation
K445 Ubiquitination
T446 Phosphorylation
T449 Phosphorylation
T458 Phosphorylation P00540 (MOS)
S459 Phosphorylation P78527 (PRKDC) , P53350 (PLK1) , P00540 (MOS)

Research Backgrounds

Function:

Vimentins are class-III intermediate filaments found in various non-epithelial cells, especially mesenchymal cells. Vimentin is attached to the nucleus, endoplasmic reticulum, and mitochondria, either laterally or terminally.

Involved with LARP6 in the stabilization of type I collagen mRNAs for CO1A1 and CO1A2.

PTMs:

Filament disassembly during mitosis is promoted by phosphorylation at Ser-55 as well as by nestin (By similarity). One of the most prominent phosphoproteins in various cells of mesenchymal origin. Phosphorylation is enhanced during cell division, at which time vimentin filaments are significantly reorganized. Phosphorylation by PKN1 inhibits the formation of filaments. Phosphorylated at Ser-56 by CDK5 during neutrophil secretion in the cytoplasm. Phosphorylated by STK33. Phosphorylated on tyrosine residues by SRMS.

O-glycosylated during cytokinesis at sites identical or close to phosphorylation sites, this interferes with the phosphorylation status.

S-nitrosylation is induced by interferon-gamma and oxidatively-modified low-densitity lipoprotein (LDL(ox)) possibly implicating the iNOS-S100A8/9 transnitrosylase complex.

Subcellular Location:

Cytoplasm. Cytoplasm>Cytoskeleton. Nucleus matrix.

Extracellular region or secreted Cytosol Plasma membrane Cytoskeleton Lysosome Endosome Peroxisome ER Golgi apparatus Nucleus Mitochondrion Manual annotation Automatic computational assertionSubcellular location
Tissue Specificity:

Highly expressed in fibroblasts, some expression in T- and B-lymphocytes, and little or no expression in Burkitt's lymphoma cell lines. Expressed in many hormone-independent mammary carcinoma cell lines.

Subunit Structure:

Homopolymer assembled from elementary dimers. Interacts with LGSN and SYNM. Interacts (via rod region) with PLEC (via CH 1 domain) (By similarity). Interacts with SLC6A4. Interacts with STK33. Interacts with LARP6. Interacts with RAB8B (By similarity). Interacts with TOR1A; the interaction associates TOR1A with the cytoskeleton. Interacts with TOR1AIP1. Interacts with BCAS3. Interacts with DIAPH1. Identified in complexes that contain VIM, EZR, AHNAK, BFSP1, BFSP2, ANK2, PLEC, PRX and spectrin (By similarity). Interacts with EPPK1; interaction is dependent of higher-order structure of intermediate filament. Interacts with the non-receptor tyrosine kinase SRMS; the interaction leads to phosphorylation of VIM. Interacts with NOD2. Interacts (via head region) with CORO1C (By similarity). Interacts with HDGF (isoform 2).

(Microbial infection) Interacts with HCV core protein.

Family&Domains:

The central alpha-helical coiled-coil IF rod domain mediates elementary homodimerization.

The [IL]-x-C-x-x-[DE] motif is a proposed target motif for cysteine S-nitrosylation mediated by the iNOS-S100A8/A9 transnitrosylase complex.

Belongs to the intermediate filament family.

Research Fields

· Human Diseases > Infectious diseases: Viral > Epstein-Barr virus infection.

· Human Diseases > Cancers: Overview > MicroRNAs in cancer.

References

1). Psychologic Stress Drives Progression of Malignant Tumors via DRD2/HIF1α Signaling. CANCER RESEARCH, 2021 (PubMed: 34321238) [IF=12.5]

2). Salidroside improves the hypoxic tumor microenvironment and reverses the drug resistance of platinum drugs via HIF-1α signaling pathway. EBioMedicine, 2018 (PubMed: 30396856) [IF=9.7]

Application: IHC    Species: mouse    Sample: tumor

Fig. 4. |Sal inhibited migration and invasion and reversed the changes in EMT biomarkers. (A–B) Cell migration was measured after treatment with various drugs for 48 h. (C–D)Representative images of Transwell cell invasion assays were obtained at 200× magnification. (E–F) Double immunofluorescence staining for E-cadherin and vimentin after treated with Sal. (G-H) The expression levels of HIF-1α in tumor tissues of subcutaneously transplanted tumor mice. Error bars represent the standard deviation of experiments performed intriplicate (*P b .05, **P b .01).

Application: IF/ICC    Species: human    Sample: HCC cells

Fig. 4. |Sal inhibited migration and invasion and reversed the changes in EMT biomarkers. (A–B) Cell migration was measured after treatment with various drugs for 48 h. (C–D)Representative images of Transwell cell invasion assays were obtained at 200× magnification. (E–F) Double immunofluorescence staining for E-cadherin and vimentin after treated with Sal. (G-H) The expression levels of HIF-1α in tumor tissues of subcutaneously transplanted tumor mice. Error bars represent the standard deviation of experiments performed intriplicate (*P b .05, **P b .01).

3). Up-regulation of miR-20a by HPV16 E6 exerts growth-promoting effects by targeting PDCD6 in cervical carcinoma cells. Biomedicine & Pharmacotherapy, 2018 (PubMed: 29710555) [IF=6.9]

4). Dihydroartemisinin inhibited vasculogenic mimicry in gastric cancer through the FGF2/FGFR1 signaling pathway. Phytomedicine : international journal of phytotherapy and phytopharmacology, 2024 (PubMed: 39214017) [IF=6.7]

Application: WB    Species: Mouse    Sample: GC cells

Fig. 7. The FGF2/FGFR1 signaling pathway regulates VM in GC cells A.VM formation of GC cells on Matrigel treated with 25 or 50 nM PD 173074 for 12 h (100 × magnification). B. Western blotting analysis of the expression of VM-associated biomarkers after FGFR1 blockade. Representative images of the wound healing assays of SGC-7901 (C) and HGC-27 (D) cells after FGFR1 blockade (100 × magnification). E shows the fold changes in migration. Transwell assays showing the migration (F) and invasion (G) of GC cells after FGFR1 blockade (200 × magnification). The number of invading cells showing migration and invasion are shown in (H) and (I). WT: Wild Type; *p < 0.05, **p < 0.01.

5). TNIK drives castration-resistant prostate cancer via phosphorylating EGFR. iScience, 2024 (PubMed: 38226156) [IF=5.8]

6). Buyang Huanwu Decoction suppresses cardiac inflammation and fibrosis in mice after myocardial infarction through inhibition of the TLR4 signalling pathway. Journal of ethnopharmacology, 2023 (PubMed: 37949329) [IF=4.8]

7). Geranylgeranylacetone, an inducer of heat shock protein 70, attenuates pulmonary fibrosis via inhibiting NF-κB/NOX4/ROS signalling pathway in vitro and in vivo. Chemico-Biological Interactions, 2023 (PubMed: 37307957) [IF=4.7]

8). LINC01060 knockdown inhibits osteosarcoma cell malignant behaviors in vitro and tumor growth and metastasis in vivo through the PI3K/Akt signaling. Cancer Biology & Therapy, 2023 (PubMed: 37211864) [IF=4.4]

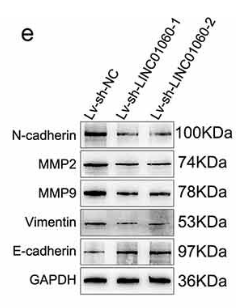
Application: WB    Species: Human    Sample: U2OS cells

Figure 3. Effects of LINC01060 knockdown on osteosarcoma cell invasion and migration. Note: U2OS cells were transfected with Lv-shLINC01060-1/2 and examined for cell migration using Wound healing assay (a-b), scale bar = 200 μm; cell invasion using Transwell pre-coated with Matrigel (c-d), scale bar = 100 μm; the protein levels of N-cadherin, MMP2, MMP9, Vimentin, and E-cadherin using Immunoblotting (e-f). All N = 3; * P 

9). Fraxin represses NF-κB pathway via inhibiting the activation of epidermal growth factor receptor to ameliorate diabetic renal tubulointerstitial fibrosis. European Journal of Pharmacology, 2023 (PubMed: 37467841) [IF=4.2]

10). Mesenchymal Stem Cells Inhibit Epithelial-to-Mesenchymal Transition by Modulating the IRE1 α Branch of the Endoplasmic Reticulum Stress Response. Stem cells international, 2023 (PubMed: 37545482) [IF=3.8]

Application: WB    Species: Human    Sample: A549 cells

Figure 1 Transforming growth factor-β1 (TGF-β1) induced Epithelial–mesenchymal transition (EMT) in A549 cells. (a) Effects of TGF-β1 (5, 10, 20 ng/ml) on the viability of A549 cells after 24, 48 and 72 hr (n = 3, one-way ANOVA with Dunnett's test). (b) Phase-contrast images of A549 cells in the different groups. Scale bar, 100 μm. (n = 3). (c) The protein expression levels of E-cadherin and vimentin were measured using western blotting, and the results were quantified using densitometry in ImageJ software (n = 3, one-way ANOVA with Duncan's post hoc test). (d) Images of immunofluorescence staining of E-cadherin (green) and vimentin (red) in A549 cells in the different groups. Scale bar, 50 μm. The data are shown as the means ± SEM ( ∗P < 0.05,  ∗∗P < 0.01 vs. the control group).

Load more

Restrictive clause


Affinity Biosciences tests all products strictly. Citations are provided as a resource for additional applications that have not been validated by Affinity Biosciences. Please choose the appropriate format for each application and consult Materials and Methods sections for additional details about the use of any product in these publications.

For Research Use Only.
Not for use in diagnostic or therapeutic procedures. Not for resale. Not for distribution without written consent. Affinity Biosciences will not be held responsible for patent infringement or other violations that may occur with the use of our products. Affinity Biosciences, Affinity Biosciences Logo and all other trademarks are the property of Affinity Biosciences LTD.