Product: LDHA Antibody
Catalog: DF6280
Description: Rabbit polyclonal antibody to LDHA
Application: WB IHC IF/ICC
Reactivity: Human, Mouse, Rat
Prediction: Pig, Bovine, Sheep, Rabbit, Dog
Mol.Wt.: 37kDa; 37kD(Calculated).
Uniprot: P00338
RRID: AB_2838246

View similar products>>

   Size Price Inventory
 100ul $280 In stock
 200ul $350 In stock

Lead Time: Same day delivery

For pricing and ordering contact:
Local distributors

Product Info

Source:
Rabbit
Application:
WB 1:500-1:2000, IHC 1:50-1:200, IF/ICC 1:100-1:500
*The optimal dilutions should be determined by the end user.
*Tips:

WB: For western blot detection of denatured protein samples. IHC: For immunohistochemical detection of paraffin sections (IHC-p) or frozen sections (IHC-f) of tissue samples. IF/ICC: For immunofluorescence detection of cell samples. ELISA(peptide): For ELISA detection of antigenic peptide.

Reactivity:
Human,Mouse,Rat
Prediction:
Pig(89%), Bovine(89%), Sheep(89%), Rabbit(89%), Dog(89%)
Clonality:
Polyclonal
Specificity:
LDHA Antibody detects endogenous levels of total LDHA.
RRID:
AB_2838246
Cite Format: Affinity Biosciences Cat# DF6280, RRID:AB_2838246.
Conjugate:
Unconjugated.
Purification:
The antiserum was purified by peptide affinity chromatography using SulfoLink™ Coupling Resin (Thermo Fisher Scientific).
Storage:
Rabbit IgG in phosphate buffered saline , pH 7.4, 150mM NaCl, 0.02% sodium azide and 50% glycerol. Store at -20 °C. Stable for 12 months from date of receipt.
Alias:

Fold/Unfold

Cell proliferation-inducing gene 19 protein; L lactate dehydrogenase A chain; Lactate dehydrogenase A; LDH A; LDH M; LDH muscle subunit; LDH1; LDH5; LDHA; PIG 19; PIG19; Renal carcinoma antigen NY-REN-59;

Immunogens

Immunogen:
Uniprot:
Gene(ID):
Description:
Lactate dehydrogenase (LDH) catalyzes the interconversion of pyruvate and NADH to lactate and NAD+. When the oxygen supply is too low for mitochondrial ATP production, this reaction recycles NADH generated in glycolysis to NAD+, which reenters glycolysis. The major form of LDH found in muscle cells is the A (LDHA) isozyme. The LDHA promoter contains HIF-1α binding sites (1). LDHA expression is induced under hypoxic conditions (2). During intensive and prolonged muscle exercise, lactate accumulates in muscle cells when the supply of oxygen does not meet demand. When oxygen levels return to normal, LDH converts lactate to pyruvate to generate ATP in the mitochondrial electron transport chain.
Sequence:
MATLKDQLIYNLLKEEQTPQNKITVVGVGAVGMACAISILMKDLADELALVDVIEDKLKGEMMDLQHGSLFLRTPKIVSGKDYNVTANSKLVIITAGARQQEGESRLNLVQRNVNIFKFIIPNVVKYSPNCKLLIVSNPVDILTYVAWKISGFPKNRVIGSGCNLDSARFRYLMGERLGVHPLSCHGWVLGEHGDSSVPVWSGMNVAGVSLKTLHPDLGTDKDKEQWKEVHKQVVESAYEVIKLKGYTSWAIGLSVADLAESIMKNLRRVHPVSTMIKGLYGIKDDVFLSVPCILGQNGISDLVKVTLTSEEEARLKKSADTLWGIQKELQF

Predictions

Predictions:

Score>80(red) has high confidence and is suggested to be used for WB detection. *The prediction model is mainly based on the alignment of immunogen sequences, the results are for reference only, not as the basis of quality assurance.

Species
Results
Score
Pig
89
Bovine
89
Sheep
89
Dog
89
Rabbit
89
Horse
0
Xenopus
0
Zebrafish
0
Chicken
0
Model Confidence:
High(score>80) Medium(80>score>50) Low(score<50) No confidence

PTMs - P00338 As Substrate

Site PTM Type Enzyme
A2 Acetylation
T3 Phosphorylation
K5 Acetylation
K5 Methylation
K5 Ubiquitination
Y10 Phosphorylation P11362 (FGFR1) , P04626 (ERBB2) , P12931 (SRC)
K14 Acetylation
K14 Sumoylation
K14 Ubiquitination
T18 Phosphorylation
K22 Acetylation
K57 Acetylation
K57 Ubiquitination
K59 Ubiquitination
T74 Phosphorylation
K76 Ubiquitination
K81 Acetylation
K81 Ubiquitination
Y83 Phosphorylation P11362 (FGFR1)
S89 Phosphorylation
K90 Ubiquitination
T95 Phosphorylation
K118 Acetylation
K118 Methylation
K118 Ubiquitination
K126 Acetylation
K126 Ubiquitination
Y127 Phosphorylation
S128 Phosphorylation
K132 Acetylation
K132 Ubiquitination
Y145 Phosphorylation
K155 Ubiquitination
R157 Methylation
S161 Phosphorylation
S167 Phosphorylation
R169 Methylation
Y172 Phosphorylation
S184 Phosphorylation
K212 Ubiquitination
K222 Acetylation
K222 Ubiquitination
K224 Acetylation
K224 Ubiquitination
K228 Acetylation
K228 Ubiquitination
K232 Acetylation
K232 Ubiquitination
S237 Phosphorylation
Y239 Phosphorylation
K243 Acetylation
K243 Ubiquitination
K245 Ubiquitination
T248 Phosphorylation P06493 (CDK1)
S249 Phosphorylation
R269 Methylation
K278 Acetylation
K278 Methylation
K278 Ubiquitination
K284 Ubiquitination
K305 Ubiquitination
T309 Phosphorylation
S310 Phosphorylation
K317 Ubiquitination
K318 Acetylation
K318 Ubiquitination
S319 Phosphorylation
T322 Phosphorylation
K328 Acetylation
K328 Sumoylation
K328 Ubiquitination

Research Backgrounds

PTMs:

ISGylated.

Subcellular Location:

Cytoplasm.

Extracellular region or secreted Cytosol Plasma membrane Cytoskeleton Lysosome Endosome Peroxisome ER Golgi apparatus Nucleus Mitochondrion Manual annotation Automatic computational assertionSubcellular location
Subunit Structure:

Homotetramer.

Family&Domains:

Belongs to the LDH/MDH superfamily. LDH family.

Research Fields

· Environmental Information Processing > Signal transduction > HIF-1 signaling pathway.   (View pathway)

· Human Diseases > Cancers: Overview > Central carbon metabolism in cancer.   (View pathway)

· Metabolism > Carbohydrate metabolism > Glycolysis / Gluconeogenesis.

· Metabolism > Amino acid metabolism > Cysteine and methionine metabolism.

· Metabolism > Carbohydrate metabolism > Pyruvate metabolism.

· Metabolism > Carbohydrate metabolism > Propanoate metabolism.

· Metabolism > Global and overview maps > Metabolic pathways.

· Organismal Systems > Endocrine system > Glucagon signaling pathway.

References

1). Bruceine A induces cell growth inhibition and apoptosis through PFKFB4/GSK3β signaling in pancreatic cancer. PHARMACOLOGICAL RESEARCH (PubMed: 33992797) [IF=9.3]

Application: WB    Species: human    Sample: MIA PaCa-2 cells

Fig. 4. | Bruceine A induces cell growth inhibition and apoptosis via PFKFB4-mediated glycolysis in MIA PaCa-2 cells. (C) MIA PaCa-2 cells were treated with various concentrations of bruceine A for 24 h. Protein levels of GLUT1, HK2, PFKFB4, PFKM, PKM2, LDHA, and β-actin were detected. β-actin was served was as control. Results were expressed as means ± SD of three independent experiments. *p < 0.05, **p < 0.01, ***p < 0.001 versus control cultured with 0.1% DMSO by one-way ANOVA and post hoc tests.

2). Agrimoniin sensitizes pancreatic cancer to apoptosis through ROS-mediated energy metabolism dysfunction. Phytomedicine (PubMed: 34785107) [IF=7.9]

3). Pimozide inhibits the growth of breast cancer cells by alleviating the Warburg effect through the P53 signaling pathway. BIOMEDICINE & PHARMACOTHERAPY (PubMed: 35658233) [IF=7.5]

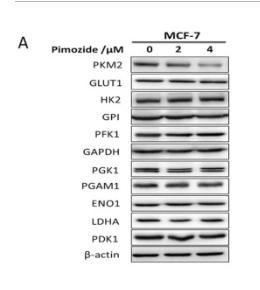
Application: WB    Species: Human    Sample: MCF-7 cells

Fig. 3. Pimozide inhibits PKM2 protein and mRNA in both MCF-7 and MDA-MB-231 cells in vitro. (A-B) Cells were treated with the indicated concentrations of Pimozide for 24 h, and the protein expression of glycolytic enzymes in MCF-7(A) and MDA-MB-231(B) cells were determined by Western blot analysis (left panel). Densitometry analysis was performed to assess the glycolytic enzymes protein expression (normalized to β-actin expression), PKM2 decreased significantly compared with untreated cells (right panel). (C-D) The mRNA expression of PKM2 in MCF-7(C) and MDA-MB-231(D) cells untreated or treated with Pimozide was determined by qRT-PCR. GAPDH was used as a control. Data represent mean ± SD from three biological replicates (*p < 0.05, **p < 0.01).

4). Oxamate Attenuates Glycolysis and ER Stress in Silicotic Mice. INTERNATIONAL JOURNAL OF MOLECULAR SCIENCES (PubMed: 35328434) [IF=5.6]

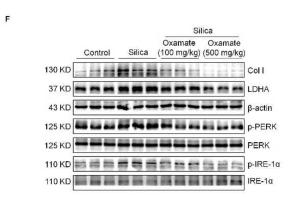
Application: WB    Species: Mice    Sample: lung tissues

Figure 7 Oxamate reduced glycolysis and ER stress in silicotic mice. (A) HE. staining of lung tissue in mice exposed to silica (scale bar = 100 µm). (B) Sirius red staining of lung tissue in mice exposed to silica (scale bar = 50 µm). (C) Expression of LDHA in mice exposed to silica measured by IF staining (scale bar = 50 µm). (D) Expression of p-PERK in silicotic mice measured by IF staining (scale bar) = 50 µm. (E) Positive expression of p-IRE-1α in silicotic mice observed by IHC staining (scale bar = 50 µm). (F) Expression levels of collagen type I (Col I), LDHA, p-PERK, and p-IRE-1α in mice lungs measured by Western blotting. Data are presented as the mean ± SD, n = 6 per group.

5). AMPK/GSK3β/β-catenin cascade-triggered overexpression of CEMIP promotes migration and invasion in anoikis-resistant prostate cancer cells by enhancing metabolic reprogramming. FASEB JOURNAL (PubMed: 29505302) [IF=4.8]

6). The miR-34a-LDHA axis regulates glucose metabolism and tumor growth in breast cancer. Scientific Reports (PubMed: 26902416) [IF=4.6]

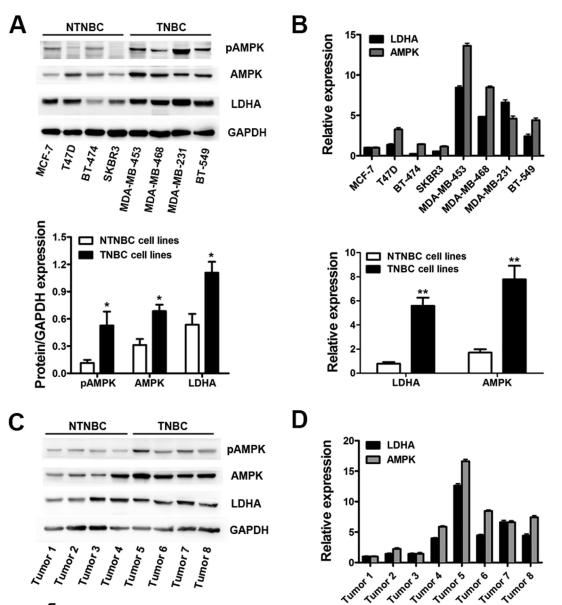
Application: WB    Species: human    Sample: breast cancer


7). Indole-3-Carbinol Stabilizes p53 to Induce miR-34a, Which Targets LDHA to Block Aerobic Glycolysis in Liver Cancer Cells. Pharmaceuticals (PubMed: 36297369) [IF=4.6]

8). S100A9 promotes glycolytic activity in HER2-positive breast cancer to induce immunosuppression in the tumour microenvironment. Heliyon (PubMed: 36755606) [IF=4.0]

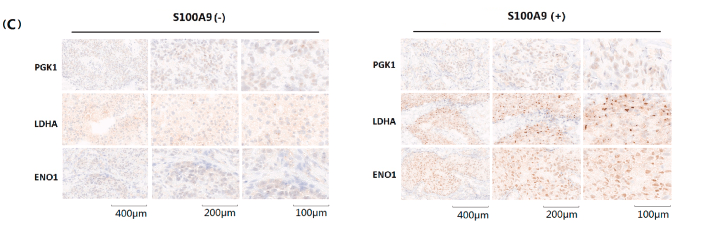
Application: IHC    Species: Human    Sample: HER2+ BRCA tissues

Fig. 2 (A) Enrichment of glycolysis-related genes was significant in S100A9 positive BRCA cases (NES > 1, FDR q-value < 0.001). (B) S100A9 silencing impaired the expression of PGK1, LDHA, and ENO1 in both SK-BR-3 and BT474 cell lines. (C) IHC staining results of HER2+ BRCA tissues confirmed the upregulation of PGK1, LDHA, and ENO1 in S100A9 abundant cases (Scale bar = 100 μm, 200 μm, and 400 μm). (D) ECAR level significantly declined when S100A9 was absent from the SK-BR-3 and BT474 cell lines. (E) lactate production and glucose consumption level significantly declined when S100A9 was absent from the SK-BR-3 and BT474 cell lines. PGK1: Phosphoglycerate kinase 1. LDHA: Lactate dehydrogenase A. ENO1: Enolase α. ECAR: Extracellular acidification rate. S100A9: S100 calcium-binding protein A9. BRCA: Breast cancer. HER2: Human epidermal growth factor receptor 2. NES: Normalised enrichment score. FDR: False discovery rate. IHC:Immunohistochemical staining.

9). High expressions of LDHA and AMPK as prognostic biomarkers for breast cancer. BREAST (PubMed: 27598996) [IF=3.9]

Application: WB    Species: human    Sample:

Fig. 1. LDHA and AMPK were up-regulated synchronously in breast cancer. A. Expression levels of LDHA, AMPK and pAMPK were assessed by Western blot (above) and gray image scanning (below) in eight different breast cancer cell lines, including four NTNBC cell lines and four TNBC cell lines. GAPDH was used as a loading control. B. Expression levels of LDHA and AMPK were determined by qRT-PCR (above). The differences between TNBC and NTNBC cell lines were analyzed (below). GAPDH was used as an internal control. C. Expression levels of LDHA, AMPK and pAMPK were assessed by Western blot (above) and gray image scanning (below) in eight different breast cancer tissues, including four NTNBC tissues and four TNBC tissues. GAPDH was used as a loading control. D. Expression levels of LDHA and AMPK were determined by qRT-PCR (above). The diffe

Application: IHC    Species: human    Sample:

Fig. 2. The expression of LDHA and AMPK showed a positive correlation in breast cancer. A. The expression of LDHA and AMPK were detected by IHC using breast cancer TMAs of 112 patients. Representative IHC images of four staining degrees (no-weak-medium-strong) of LDHA and AMPK expression under a microscope were showed (400). B. The correlation between LDHA and AMPK expression scores of 112 breast cancer patients was analyzed and a positive correlation between them was showed.

10). Yes associated protein 1 promotes resistance to 5-fluorouracil in gastric cancer by regulating GLUT3-dependent glycometabolism reprogramming of tumor-associated macrophages. ARCHIVES OF BIOCHEMISTRY AND BIOPHYSICS (PubMed: 33727040) [IF=3.9]

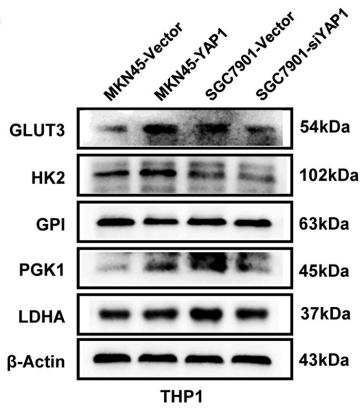
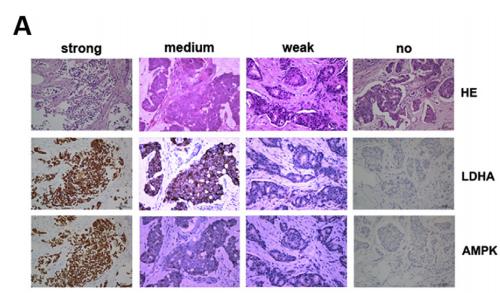
Application: WB    Species: Mice    Sample: GC cells

Fig. 3. IL13 secreted by YAP1-overexpressed GC cells stimulates resistance to 5-FU via inducing M2 subtype macrophage glycolysis reprogramming. A-C. RT-PCR was used to detect the mRNA expression of glycolysis enzymes, fatty acid and amino acid metabolism enzymes in THP1 after co-cultured with MKN-YAP1 or MKN45-Vetor. D. Protein level change of glycolysis enzymes in THP1 after co-cultured with MKN-YAP1, MKN45-Vetor, SGC7901-siYAP1 or SGC7901-NC. E. RT-PCR revealed the mRNA expression of glycolysis enzymes and M2 TAMs markers in THP1 after co-cultured with SGC7901-siYAP1 or SGC7901-NC. F-G. Relative lactate release from cells was determined by colorimetric analysis. Relative glucose uptake cells by Flow cytometry detection. All data presented are the mean ± SD (*p < 0.05, **p < 0.01) of triplicate determination from three independent experiments.

Load more

Restrictive clause


Affinity Biosciences tests all products strictly. Citations are provided as a resource for additional applications that have not been validated by Affinity Biosciences. Please choose the appropriate format for each application and consult Materials and Methods sections for additional details about the use of any product in these publications.

For Research Use Only.
Not for use in diagnostic or therapeutic procedures. Not for resale. Not for distribution without written consent. Affinity Biosciences will not be held responsible for patent infringement or other violations that may occur with the use of our products. Affinity Biosciences, Affinity Biosciences Logo and all other trademarks are the property of Affinity Biosciences LTD.