SYVN1 Antibody - #DF12235

| Product: | SYVN1 Antibody |
| Catalog: | DF12235 |
| Description: | Rabbit polyclonal antibody to SYVN1 |
| Application: | WB IHC IF/ICC |
| Reactivity: | Human, Mouse, Rat |
| Prediction: | Pig, Bovine, Horse, Sheep, Rabbit, Dog |
| Mol.Wt.: | 68-76 kDa; 68kD(Calculated). |
| Uniprot: | Q86TM6 |
| RRID: | AB_2845040 |
Related Downloads
Protocols
Product Info
*The optimal dilutions should be determined by the end user.
*Tips:
WB: For western blot detection of denatured protein samples. IHC: For immunohistochemical detection of paraffin sections (IHC-p) or frozen sections (IHC-f) of tissue samples. IF/ICC: For immunofluorescence detection of cell samples. ELISA(peptide): For ELISA detection of antigenic peptide.
Cite Format: Affinity Biosciences Cat# DF12235, RRID:AB_2845040.
Fold/Unfold
1200010C09Rik; DER3; E3 ubiquitin-protein ligase synoviolin; HMG coA reductase degradation 1 homolog; HRD1; KIAA1810; MGC40372; OTTHUMP00000230429; OTTHUMP00000230430; OTTHUMP00000230431; OTTHUMP00000230432; Synovial apoptosis inhibitor 1; Synovial apoptosis inhibitor 1, synoviolin; Synoviolin 1 isoform b; SYNOVIOLIN; SYVN1; SYVN1_HUMAN;
Immunogens
Ubiquitously expressed, with highest levels in liver and kidney (at protein level). Up-regulated in synovial tissues from patients with rheumatoid arthritis (at protein level).
- Q86TM6 SYVN1_HUMAN:
- Protein BLAST With
- NCBI/
- ExPASy/
- Uniprot
MFRTAVMMAASLALTGAVVAHAYYLKHQFYPTVVYLTKSSPSMAVLYIQAFVLVFLLGKVMGKVFFGQLRAAEMEHLLERSWYAVTETCLAFTVFRDDFSPRFVALFTLLLFLKCFHWLAEDRVDFMERSPNISWLFHCRIVSLMFLLGILDFLFVSHAYHSILTRGASVQLVFGFEYAILMTMVLTIFIKYVLHSVDLQSENPWDNKAVYMLYTELFTGFIKVLLYMAFMTIMIKVHTFPLFAIRPMYLAMRQFKKAVTDAIMSRRAIRNMNTLYPDATPEELQAMDNVCIICREEMVTGAKRLPCNHIFHTSCLRSWFQRQQTCPTCRMDVLRASLPAQSPPPPEPADQGPPPAPHPPPLLPQPPNFPQGLLPPFPPGMFPLWPPMGPFPPVPPPPSSGEAVAPPSTSAAALSRPSGAATTTAAGTSATAASATASGPGSGSAPEAGPAPGFPFPPPWMGMPLPPPFAFPPMPVPPAGFAGLTPEELRALEGHERQHLEARLQSLRNIHTLLDAAMLQINQYLTVLASLGPPRPATSVNSTEETATTVVAAASSTSIPSSEATTPTPGASPPAPEMERPPAPESVGTEEMPEDGEPDAAELRRRRLQKLESPVAH
Predictions
Score>80(red) has high confidence and is suggested to be used for WB detection. *The prediction model is mainly based on the alignment of immunogen sequences, the results are for reference only, not as the basis of quality assurance.
High(score>80) Medium(80>score>50) Low(score<50) No confidence
PTMs - Q86TM6 As Substrate
| Site | PTM Type | Enzyme | Source |
|---|---|---|---|
| T93 | Phosphorylation | Uniprot | |
| K191 | Ubiquitination | Uniprot | |
| K257 | Ubiquitination | Uniprot | |
| T260 | Phosphorylation | Uniprot | |
| S265 | Phosphorylation | Uniprot | |
| K303 | Ubiquitination | Uniprot | |
| T557 | Phosphorylation | Uniprot | |
| S558 | Phosphorylation | Uniprot | |
| S562 | Phosphorylation | Uniprot | |
| T565 | Phosphorylation | Uniprot | |
| S572 | Phosphorylation | Uniprot | |
| S613 | Phosphorylation | Uniprot |
Research Backgrounds
Acts as an E3 ubiquitin-protein ligase which accepts ubiquitin specifically from endoplasmic reticulum-associated UBC7 E2 ligase and transfers it to substrates, promoting their degradation. Component of the endoplasmic reticulum quality control (ERQC) system also called ER-associated degradation (ERAD) involved in ubiquitin-dependent degradation of misfolded endoplasmic reticulum proteins. Also promotes the degradation of normal but naturally short-lived proteins such as SGK. Protects cells from ER stress-induced apoptosis. Protects neurons from apoptosis induced by polyglutamine-expanded huntingtin (HTT) or unfolded GPR37 by promoting their degradation. Sequesters p53/TP53 in the cytoplasm and promotes its degradation, thereby negatively regulating its biological function in transcription, cell cycle regulation and apoptosis. Mediates the ubiquitination and subsequent degradation of cytoplasmic NFE2L1 (By similarity).
Not N-glycosylated.
Auto-ubiquitinated.
Endoplasmic reticulum membrane>Multi-pass membrane protein.
Ubiquitously expressed, with highest levels in liver and kidney (at protein level). Up-regulated in synovial tissues from patients with rheumatoid arthritis (at protein level).
Homodimer. Interacts with p53/TP53 and HTT. Interacts with VCP, HERPUD1 and DERL1. Part of a complex containing SYVN1, HERPUD1, VIMP and DERL1; which probably transfer misfolded proteins from the ER to VCP. Part of a complex containing SYVN1, SEL1L and DERL2. Interacts with UBXN6. Interacts (via N-terminal loop) with SEL1L; recruits ERLEC1 and OS9. May form a complex with ERLEC1; HSPA5; OS9 AND SEL1L. Interacts with BAG6. Interacts with NFE2L1 (By similarity).
The RING-type zinc finger is required for E3 ligase activity.
Belongs to the HRD1 family.
Research Fields
· Genetic Information Processing > Folding, sorting and degradation > Ubiquitin mediated proteolysis. (View pathway)
· Genetic Information Processing > Folding, sorting and degradation > Protein processing in endoplasmic reticulum. (View pathway)
References
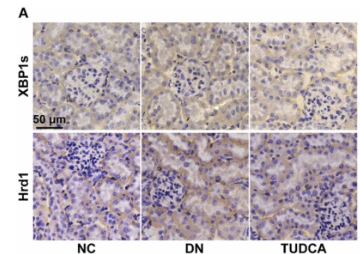
Application: IHC Species: Mouse Sample: kidney tissues
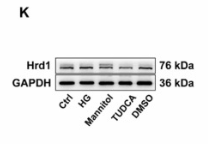
Application: WB Species: Human Sample: HK-2 cells
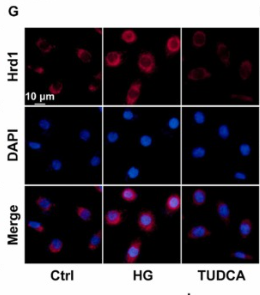
Application: IF/ICC Species: Human Sample: HK-2 cells
Restrictive clause
Affinity Biosciences tests all products strictly. Citations are provided as a resource for additional applications that have not been validated by Affinity Biosciences. Please choose the appropriate format for each application and consult Materials and Methods sections for additional details about the use of any product in these publications.
For Research Use Only.
Not for use in diagnostic or therapeutic procedures. Not for resale. Not for distribution without written consent. Affinity Biosciences will not be held responsible for patent infringement or other violations that may occur with the use of our products. Affinity Biosciences, Affinity Biosciences Logo and all other trademarks are the property of Affinity Biosciences LTD.