ACOX1 Antibody - #DF12046

Related Downloads
Protocols
Product Info
*The optimal dilutions should be determined by the end user.
*Tips:
WB: For western blot detection of denatured protein samples. IHC: For immunohistochemical detection of paraffin sections (IHC-p) or frozen sections (IHC-f) of tissue samples. IF/ICC: For immunofluorescence detection of cell samples. ELISA(peptide): For ELISA detection of antigenic peptide.
Cite Format: Affinity Biosciences Cat# DF12046, RRID:AB_2844851.
Fold/Unfold
ACOX; ACOX1; ACOX1_HUMAN; Acyl CoA oxidase 1 palmitoyl; Acyl CoA oxidase straight chain; AOX; EC 1.3.3.6; PALMCOX; Palmitoyl CoA oxidase; Palmitoyl-CoA oxidase; Peroxisomal acyl coenzyme A oxidase 1; Peroxisomal acyl-coenzyme A oxidase 1; Peroxisomal fatty acyl CoA oxidase; SCOX; Straight chain acyl CoA oxidase; Straight-chain acyl-CoA oxidase;
Immunogens
Widely expressed with highest levels of isoform 1 and isoform 2 detected in testis. Isoform 1 is expressed at higher levels than isoform 2 in liver and kidney while isoform 2 levels are higher in brain, lung, muscle, white adipose tissue and testis. Levels are almost equal in heart.
- Q15067 ACOX1_HUMAN:
- Protein BLAST With
- NCBI/
- ExPASy/
- Uniprot
MNPDLRRERDSASFNPELLTHILDGSPEKTRRRREIENMILNDPDFQHEDLNFLTRSQRYEVAVRKSAIMVKKMREFGIADPDEIMWFKKLHLVNFVEPVGLNYSMFIPTLLNQGTTAQKEKWLLSSKGLQIIGTYAQTEMGHGTHLRGLETTATYDPETQEFILNSPTVTSIKWWPGGLGKTSNHAIVLAQLITKGKCYGLHAFIVPIREIGTHKPLPGITVGDIGPKFGYDEIDNGYLKMDNHRIPRENMLMKYAQVKPDGTYVKPLSNKLTYGTMVFVRSFLVGEAARALSKACTIAIRYSAVRHQSEIKPGEPEPQILDFQTQQYKLFPLLATAYAFQFVGAYMKETYHRINEGIGQGDLSELPELHALTAGLKAFTSWTANTGIEACRMACGGHGYSHCSGLPNIYVNFTPSCTFEGENTVMMLQTARFLMKSYDQVHSGKLVCGMVSYLNDLPSQRIQPQQVAVWPTMVDINSPESLTEAYKLRAARLVEIAAKNLQKEVIHRKSKEVAWNLTSVDLVRASEAHCHYVVVKLFSEKLLKIQDKAIQAVLRSLCLLYSLYGISQNAGDFLQGSIMTEPQITQVNQRVKELLTLIRSDAVALVDAFDFQDVTLGSVLGRYDGNVYENLFEWAKNSPLNKAEVHESYKHLKSLQSKL
Predictions
Score>80(red) has high confidence and is suggested to be used for WB detection. *The prediction model is mainly based on the alignment of immunogen sequences, the results are for reference only, not as the basis of quality assurance.
High(score>80) Medium(80>score>50) Low(score<50) No confidence
PTMs - Q15067 As Substrate
| Site | PTM Type | Enzyme | Source |
|---|---|---|---|
| T20 | Phosphorylation | Uniprot | |
| S26 | Phosphorylation | Uniprot | |
| K29 | Ubiquitination | Uniprot | |
| K89 | Acetylation | Uniprot | |
| K122 | Ubiquitination | Uniprot | |
| S127 | Phosphorylation | Uniprot | |
| S167 | Phosphorylation | Uniprot | |
| K198 | Acetylation | Uniprot | |
| Y200 | Phosphorylation | Uniprot | |
| K216 | Ubiquitination | Uniprot | |
| Y232 | Phosphorylation | Uniprot | |
| K255 | Acetylation | Uniprot | |
| Y256 | Phosphorylation | Uniprot | |
| K260 | Ubiquitination | Uniprot | |
| K267 | Acetylation | Uniprot | |
| Y275 | Phosphorylation | Uniprot | |
| K295 | Ubiquitination | Uniprot | |
| K437 | Acetylation | Uniprot | |
| Y487 | Phosphorylation | Uniprot | |
| K500 | Acetylation | Uniprot | |
| K504 | Acetylation | Uniprot | |
| K512 | Acetylation | Uniprot | |
| Y629 | Phosphorylation | Uniprot | |
| S639 | Phosphorylation | Uniprot | |
| K643 | Acetylation | Uniprot | |
| K643 | Ubiquitination | Uniprot | |
| S649 | Phosphorylation | Uniprot | |
| K651 | Acetylation | Uniprot |
Research Backgrounds
Catalyzes the desaturation of acyl-CoAs to 2-trans-enoyl-CoAs. Isoform 1 shows highest activity against medium-chain fatty acyl-CoAs and activity decreases with increasing chain length. Isoform 2 is active against a much broader range of substrates and shows activity towards very long-chain acyl-CoAs. Isoform 2 is twice as active as isoform 1 against 16-hydroxy-palmitoyl-CoA and is 25% more active against 1,16-hexadecanodioyl-CoA.
Peroxisome.
Widely expressed with highest levels of isoform 1 and isoform 2 detected in testis. Isoform 1 is expressed at higher levels than isoform 2 in liver and kidney while isoform 2 levels are higher in brain, lung, muscle, white adipose tissue and testis. Levels are almost equal in heart.
Homodimer (By similarity). Interacts with LONP2.
Belongs to the acyl-CoA oxidase family.
Research Fields
· Cellular Processes > Transport and catabolism > Peroxisome. (View pathway)
· Environmental Information Processing > Signal transduction > cAMP signaling pathway. (View pathway)
· Metabolism > Lipid metabolism > Fatty acid degradation.
· Metabolism > Lipid metabolism > alpha-Linolenic acid metabolism.
· Metabolism > Lipid metabolism > Biosynthesis of unsaturated fatty acids.
· Metabolism > Global and overview maps > Metabolic pathways.
· Metabolism > Global and overview maps > Fatty acid metabolism.
· Organismal Systems > Endocrine system > PPAR signaling pathway.
References
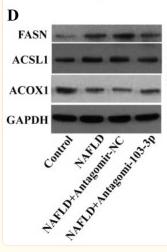
Application: WB Species: Human Sample: L02 cell
Application: WB Species: Rat Sample:
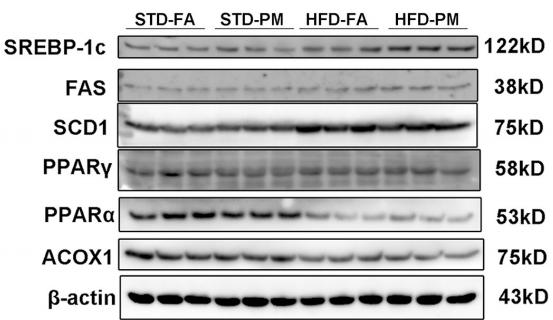
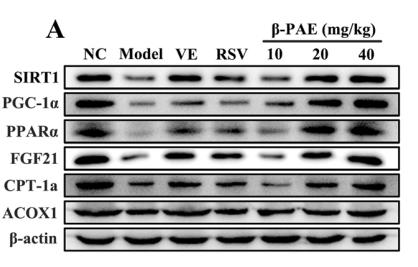
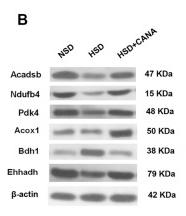
Application: WB Species: mouse Sample: liver
Application: WB Species: Mice Sample: liver tissue

Application: WB Species: Mouse Sample: HepG2 cells
Restrictive clause
Affinity Biosciences tests all products strictly. Citations are provided as a resource for additional applications that have not been validated by Affinity Biosciences. Please choose the appropriate format for each application and consult Materials and Methods sections for additional details about the use of any product in these publications.
For Research Use Only.
Not for use in diagnostic or therapeutic procedures. Not for resale. Not for distribution without written consent. Affinity Biosciences will not be held responsible for patent infringement or other violations that may occur with the use of our products. Affinity Biosciences, Affinity Biosciences Logo and all other trademarks are the property of Affinity Biosciences LTD.