Leptin Antibody - #DF8583

Related Downloads
Protocols
Product Info
*The optimal dilutions should be determined by the end user.
*Tips:
WB: For western blot detection of denatured protein samples. IHC: For immunohistochemical detection of paraffin sections (IHC-p) or frozen sections (IHC-f) of tissue samples. IF/ICC: For immunofluorescence detection of cell samples. ELISA(peptide): For ELISA detection of antigenic peptide.
Cite Format: Affinity Biosciences Cat# DF8583, RRID:AB_2841787.
Fold/Unfold
FLJ94114; LEP; LEP_HUMAN; LEPD; Leptin (murine obesity homolog); Leptin (obesity homolog, mouse); Leptin; Leptin Murine Obesity Homolog; Leptin Precursor Obesity Factor; OB; Obese protein; Obese, mouse, homolog of; Obesity; Obesity factor; Obesity homolog mouse; Obesity Murine Homolog Leptin; OBS; OTTHUMP00000212285;
Immunogens
Adipose tissue is the main source of leptin. It is also produced by other peripheral tissues such as the skeletal muscle (PubMed:7789654, PubMed:16052473, PubMed:12448771). Expressed by intercalated and striated tracts of submandibular and parotid salivary gland intralobular ducts (PubMed:12448771). Detected by fundic epithelium of the gastric mucosa (PubMed:10896907). Secreted into blood and gastric juice (PubMed:10896907).
- P41159 LEP_HUMAN:
- Protein BLAST With
- NCBI/
- ExPASy/
- Uniprot
MHWGTLCGFLWLWPYLFYVQAVPIQKVQDDTKTLIKTIVTRINDISHTQSVSSKQKVTGLDFIPGLHPILTLSKMDQTLAVYQQILTSMPSRNVIQISNDLENLRDLLHVLAFSKSCHLPWASGLETLDSLGGVLEASGYSTEVVALSRLQGSLQDMLWQLDLSPGC
Predictions
Score>80(red) has high confidence and is suggested to be used for WB detection. *The prediction model is mainly based on the alignment of immunogen sequences, the results are for reference only, not as the basis of quality assurance.
High(score>80) Medium(80>score>50) Low(score<50) No confidence
PTMs - P41159 As Substrate
| Site | PTM Type | Enzyme | Source |
|---|---|---|---|
| T48 | Phosphorylation | Uniprot |
Research Backgrounds
Key player in the regulation of energy balance and body weight control. Once released into the circulation, has central and peripheral effects by binding LEPR, found in many tissues, which results in the activation of several major signaling pathways. In the hypothalamus, acts as an appetite-regulating factor that induces a decrease in food intake and an increase in energy consumption by inducing anorexinogenic factors and suppressing orexigenic neuropeptides, also regulates bone mass and secretion of hypothalamo-pituitary-adrenal hormones. In the periphery, increases basal metabolism, influences reproductive function, regulates pancreatic beta-cell function and insulin secretion, is pro-angiogenic for endothelial cell and affects innate and adaptive immunity (By similarity). In the arcuate nucleus of the hypothalamus, activates by depolarization POMC neurons inducing FOS and SOCS3 expression to release anorexigenic peptides and inhibits by hyperpolarization NPY neurons inducing SOCS3 with a consequent reduction on release of orexigenic peptides (By similarity). In addition to its known satiety inducing effect, has a modulatory role in nutrient absorption. In the intestine, reduces glucose absorption by enterocytes by activating PKC and leading to a sequential activation of p38, PI3K and ERK signaling pathways which exerts an inhibitory effect on glucose absorption. Acts as a growth factor on certain tissues, through the activation of different signaling pathways increases expression of genes involved in cell cycle regulation such as CCND1, via JAK2-STAT3 pathway, or VEGFA, via MAPK1/3 and PI3K-AKT1 pathways (By similarity). May also play an apoptotic role via JAK2-STAT3 pathway and up-regulation of BIRC5 expression. Pro-angiogenic, has mitogenic activity on vascular endothelial cells and plays a role in matrix remodeling by regulating the expression of matrix metalloproteinases (MMPs) and tissue inhibitors of metalloproteinases (TIMPs). In innate immunity, modulates the activity and function of neutrophils by increasing chemotaxis and the secretion of oxygen radicals. Increases phagocytosis by macrophages and enhances secretion of pro-inflammatory mediators. Increases cytotoxic ability of NK cells. Plays a pro-inflammatory role, in synergy with IL1B, by inducing NOS2 wich promotes the production of IL6, IL8 and Prostaglandin E2, through a signaling pathway that involves JAK2, PI3K, MAP2K1/MEK1 and MAPK14/p38. In adaptive immunity, promotes the switch of memory T-cells towards T helper-1 cell immune responses (By similarity). Increases CD4(+)CD25(-) T-cell proliferation and reduces autophagy during TCR (T-cell receptor) stimulation, through MTOR signaling pathway activation and BCL2 up-regulation.
Secreted.
Adipose tissue is the main source of leptin. It is also produced by other peripheral tissues such as the skeletal muscle. Expressed by intercalated and striated tracts of submandibular and parotid salivary gland intralobular ducts. Detected by fundic epithelium of the gastric mucosa. Secreted into blood and gastric juice.
Interacts with SIGLEC6.
Belongs to the leptin family.
Research Fields
· Environmental Information Processing > Signaling molecules and interaction > Cytokine-cytokine receptor interaction. (View pathway)
· Environmental Information Processing > Signaling molecules and interaction > Neuroactive ligand-receptor interaction.
· Environmental Information Processing > Signal transduction > AMPK signaling pathway. (View pathway)
· Environmental Information Processing > Signal transduction > Jak-STAT signaling pathway. (View pathway)
· Human Diseases > Endocrine and metabolic diseases > Non-alcoholic fatty liver disease (NAFLD).
· Organismal Systems > Endocrine system > Adipocytokine signaling pathway.
References
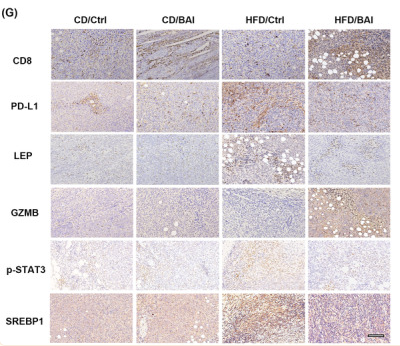
Application: IHC Species: Mouse Sample:
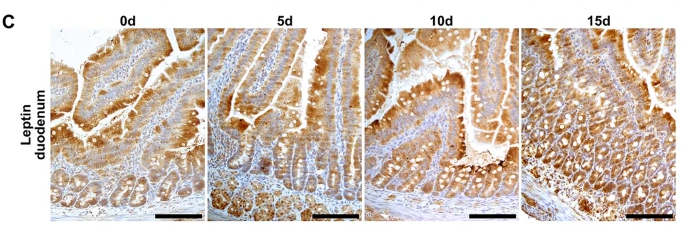
Application: IHC Species: Rat Sample:
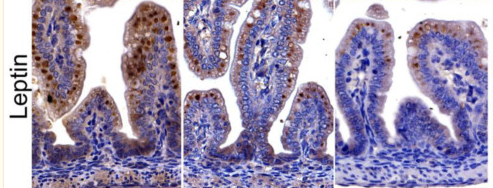
Application: IHC Species: Rat Sample:
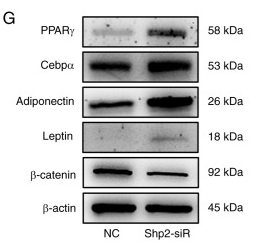
Application: WB Species: Rat Sample:
Restrictive clause
Affinity Biosciences tests all products strictly. Citations are provided as a resource for additional applications that have not been validated by Affinity Biosciences. Please choose the appropriate format for each application and consult Materials and Methods sections for additional details about the use of any product in these publications.
For Research Use Only.
Not for use in diagnostic or therapeutic procedures. Not for resale. Not for distribution without written consent. Affinity Biosciences will not be held responsible for patent infringement or other violations that may occur with the use of our products. Affinity Biosciences, Affinity Biosciences Logo and all other trademarks are the property of Affinity Biosciences LTD.